College Statistics Help: Video Lessons & Practice
Work through every topic with clear, step-by-step solutions. Start your free practice test now!

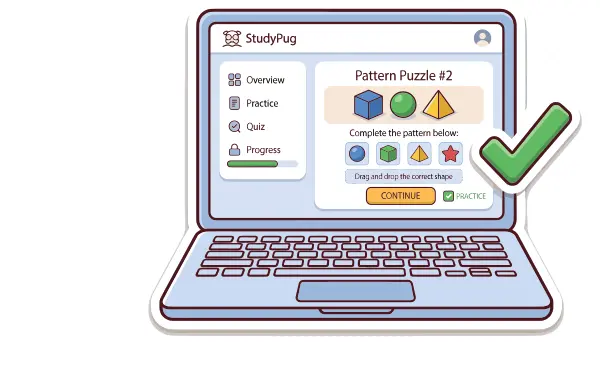
Value vs. Private Tutor
Expert help without the tutor price tag.

Multi-Subject
Switch from stats to any subject anytime.
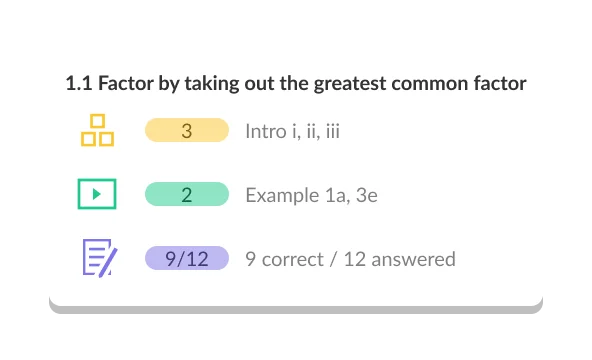
Build Mastery
Move on only after truly nailing it.
Try It Now
Test your knowledge
Our approach aligns with the evidence
Exam Scores
Better Recall
Less Anxiety
College Statistics Topics
1. Basic Concepts
2. Data Representation
3. Data Interpretation
4. Probability
5. Set Theory
6. Discrete Probabilities
7. Normal Distribution and Z-Scores
8. Confidence Intervals
9. Hypothesis Testing
9 Chapters · 54 Topics · 423 Videos
Discover Our Learning Areas
Explore key subjects and start learning with interactive content.








What is College Statistics?
College Statistics is the university-level study of how to collect, organise, analyse, and interpret numerical data to support decision-making and draw reliable conclusions. In a single sentence: it is the discipline that lets you turn raw numbers into meaningful insights. Taught across science, business, health, engineering, and social science degrees at Australian universities, the course bridges descriptive methods — summarising what data shows — and inferential methods — drawing conclusions about populations from samples. Students who complete College Statistics are equipped with skills that appear in almost every quantitative field, making it one of the most broadly applicable units in any undergraduate degree.
What topics are covered in College Statistics?
A typical Australian university College Statistics unit moves through a well-established sequence. It begins with descriptive statistics: measures of central tendency (mean, median, mode), measures of spread (variance, standard deviation, IQR), and data visualisation through histograms, box plots, and scatter plots.
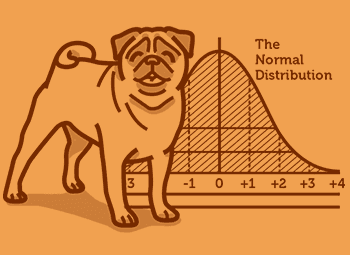
From there, the course introduces probability theory — the mathematical foundation of all statistical inference. This includes probability rules, conditional probability, Bayes' theorem, and the key probability distributions: normal, binomial, Poisson, and t-distributions. Many students find this section the sharpest conceptual jump from secondary-school mathematics.
The second half of the course focuses on statistical inference: constructing confidence intervals, performing hypothesis tests (one-sample and two-sample t-tests, chi-square tests, ANOVA), and understanding p-values and significance levels. Units typically conclude with correlation and linear regression, covering how to fit a line to data, interpret coefficients, and assess model fit using R-squared and residual analysis.
Some courses also introduce non-parametric alternatives (Mann-Whitney, Kruskal-Wallis) and basic multiple regression. Throughout all of these topics, the emphasis is on interpretation — not just producing a number, but explaining what it means in context.
Is College Statistics hard for university students?
College Statistics has a reputation for being difficult, and that reputation is partly earned. The challenge is not usually computational — modern assessments permit statistical software or calculators — but conceptual. Students who expect a continuation of Year 12 mathematics often find the shift to probabilistic reasoning unexpected.
The topics where students most commonly seek College Statistics help are:
- Conditional probability and Bayes' theorem — the logic feels counterintuitive until you work through enough examples.
- Choosing the correct hypothesis test — knowing when to use a t-test versus ANOVA versus chi-square requires understanding the structure of your data.
- Interpreting p-values correctly — a p-value of 0.03 does not mean "there is a 97% chance the null is false," and many students carry this misconception into assessments.
- Regression interpretation — reading coefficient tables and writing plain-language conclusions is a skill that needs deliberate practice.
The consistent finding across statistics education research is that regular, spaced practice on varied problems — rather than reading notes or watching passively — is what builds genuine competence. College Statistics practice problems and mock assessments are the most effective preparation tools available.
How is College Statistics assessed at Australian universities?
Assessment structures vary by institution, but the typical Australian university College Statistics unit combines:
- Assignments or lab reports (20–40% of grade): usually involving real datasets, software output interpretation, and written conclusions.
- Mid-semester exam or quiz: covers descriptive statistics and probability, usually worth 20–30%.
- Final examination: two to three hours, covering the full unit. The final exam tests hypothesis testing, regression, and probability under time pressure and is typically worth 40–50% of the total grade.
Grades in Australian universities follow the HD/D/C/P/Fail scale. A High Distinction (HD) generally requires 85% or above, while a Pass requires 50%. Students preparing for the final examination benefit most from timed, exam-style College Statistics practice tests that cover multiple topic areas in a single sitting — replicating the conditions of the actual assessment.
Why StudyPug for College Statistics?
StudyPug is built for the way university students actually study: in short sessions between lectures, late the night before a tutorial, or intensively in the week before a final exam. The platform combines three things that work together: a diagnostic assessment, adaptive practice, and certified-teacher concept videos.
The diagnostic assessment runs first. It identifies precisely which College Statistics topics you need to work on — probability distributions, confidence intervals, hypothesis testing — so you are not reviewing material you already understand. This matters when your time is limited.
Adaptive practice then adjusts difficulty to your current performance. As you get hypothesis testing problems right, the system moves you to harder variations. If you stall on a concept, it keeps you at that level until you are genuinely ready to progress. This is not passive reading — it is active practice that builds real skill.
The concept videos are made by certified teachers, not AI. They teach the method — why you set up a hypothesis test the way you do, what regression coefficients actually represent, why the normal distribution underpins so much of inference. The goal is deep understanding, so you are prepared for the next statistics course or a research methods unit, not just the end-of-semester exam.
All courses — College Statistics, Calculus I through III, Linear Algebra, Differential Equations — are included in a single StudyPug subscription. You can watch lessons an unlimited number of times. There are no separate purchases per topic or per course.
What you learn — College Statistics course coverage
StudyPug's College Statistics content covers the full scope of a standard Australian university unit, structured to match how courses are actually taught and assessed:
- Descriptive statistics: mean, median, mode, variance, standard deviation, IQR
- Data visualisation: histograms, box plots, scatter plots, frequency tables
- Probability rules, conditional probability, independence, Bayes' theorem
- Probability distributions: normal, binomial, Poisson, t, chi-square, F
- Sampling distributions and the Central Limit Theorem
- Confidence intervals for means and proportions
- Hypothesis testing: one-sample t-test, two-sample t-test, paired t-test, chi-square test, one-way ANOVA
- Correlation and simple linear regression: fitting, interpreting, and assessing models
- Introduction to multiple regression and model diagnostics
- Non-parametric tests: Mann-Whitney, Kruskal-Wallis (where applicable)
Because no validated topic-page URLs are currently available in the link map for this course, all topic navigation is handled through the topic browser on the course page itself. Use the Browse Topics button above to jump directly to the area where you need College Statistics help.
Using StudyPug to improve your College Statistics results
The most effective way to use StudyPug for College Statistics is to integrate it with your regular study schedule rather than saving it for the week before exams.
Start with the diagnostic. Before watching any videos, run the diagnostic assessment. It takes a few minutes and tells you exactly where your knowledge gaps are. Students are often surprised — they expect to struggle with hypothesis testing but the diagnostic reveals the gap is actually in probability foundations. Fixing the right problem first saves hours.
Watch the concept video, then practise immediately. After watching a certified-teacher video on, say, the Central Limit Theorem, go straight to the related practice problems. The adaptive system will start at an appropriate level and escalate as you improve. This active retrieval after watching is where the learning actually consolidates.
Use mock assessments to simulate exam conditions. In the two weeks before your mid-semester or final exam, work through full College Statistics practice tests under timed conditions. This builds the test-taking stamina and decision speed that real assessments require. If you get a question wrong, go back to the concept video for that topic and re-do similar problems until the method is automatic.
Return to videos as many times as you need. There is no limit on replays. If regression interpretation still feels uncertain the day before your exam, watch the video again. Understanding needs to be solid, not approximate.
StudyPug is available on any device — laptop, tablet, or phone — so you can fit College Statistics practice into whatever time you have available, whether that is 20 minutes between lectures or a focused three-hour session on a Sunday afternoon. With free daily practice content available before you subscribe, and a 30-day money-back guarantee once you do, there is no reason to wait until the semester gets away from you.
College Statistics FAQ
Unsure how StudyPug works? Need help with setting up? Check our frequently asked questions or contact us for help.
What do you learn in College Statistics, and what topics does it cover?
College Statistics covers the core methods used to collect, analyse, and interpret data. Key topics include descriptive statistics (mean, median, standard deviation), probability theory, probability distributions (normal, binomial, Poisson), sampling techniques, confidence intervals, hypothesis testing (t-tests, chi-square, ANOVA), correlation, and linear regression. Many courses also introduce non-parametric methods and basic data visualisation. By the end, you can draw meaningful conclusions from real-world data — a skill essential across science, business, health, and social sciences.
What is the difference between College Statistics and Advanced Statistics or Econometrics?
College Statistics is the foundational course, focusing on core inference methods, probability, and regression. Advanced Statistics builds on that foundation with multivariate methods, time-series analysis, and more complex model selection. Econometrics specifically applies statistical techniques to economic data, emphasising regression diagnostics, panel data, and instrumental variables. If you are comfortable with hypothesis testing and simple linear regression from College Statistics, you are well positioned to move into either advanced course. Understanding the basics thoroughly makes the step up significantly easier.
What are the prerequisites for College Statistics, and what course comes after it?
Most Australian universities require at least Year 12 Mathematics (Methods or equivalent) before enrolling in College Statistics. Some programs accept a bridging maths unit. After completing College Statistics you can progress to Advanced Statistical Modelling, Applied Regression Analysis, Biostatistics, or Econometrics depending on your degree. Data science and machine learning courses also typically list a completed Statistics unit as a prerequisite. A solid grounding in algebra and basic calculus will make the probabilistic material much less daunting.
Is College Statistics hard, and where do students struggle most?
College Statistics is challenging, especially for students who find abstract reasoning difficult. The most common struggle points are probability theory (particularly conditional probability and Bayes' theorem), understanding when to apply which hypothesis test, and interpreting p-values correctly. Many students also find the leap from calculation to interpretation hard — statistics is not just arithmetic, it requires conceptual understanding. The good news is that with consistent practice on worked examples and mock assessments, these concepts become manageable. Regular practice is far more effective than last-minute cramming.
How is College Statistics assessed — and how does it relate to Australian university grading?
In Australian universities, College Statistics is typically assessed through a combination of assignments or lab reports (worth 20–40% of the final mark), a mid-semester exam or quiz, and a final examination. Final exams are usually two to three hours and test hypothesis testing, regression, and probability interpretation under timed conditions. Grades are awarded as High Distinction (HD), Distinction (D), Credit (C), Pass (P), or Fail. Consistent practice on past exam-style problems and timed mock tests is the most effective preparation strategy for final assessments.
What is one of the hardest topics in College Statistics, and how do you approach it?
Hypothesis testing is widely considered the hardest topic in College Statistics. Students often struggle to choose the correct test (t-test vs. chi-square vs. ANOVA), set up the null and alternative hypotheses correctly, and interpret what a p-value actually means in context. The best approach is to start with a clear conceptual understanding of what you are testing and why, then build a step-by-step routine: state hypotheses, choose the test, check assumptions, calculate the test statistic, compare to the critical value, and write a plain-language conclusion. Worked examples and repeated practice make this process automatic.





Written by the StudyPug Team
Last updated June 5, 2026
3 M+
students
★★★★★
4.8 average
K–12
all grades