Statistics Help: Video Lessons & Practice
Work through every topic with clear solutions. Start your free practice test now!

Certified-Teacher Statistics Video Lessons
Watch step-by-step Statistics video lessons from experienced, certified teachers — not AI. Understand the method deeply so you're ready for your next course, not just this exam.

Diagnostic Assessment + Adaptive Practice
A quick diagnostic pinpoints exactly where to focus. Then adaptive practice adjusts difficulty to your performance — so every session builds the skills that matter most.

Statistics Exam Preparation
Prepare for mid-semester and final exams with Statistics mock tests and comprehensive topic review — covering probability, inference, and regression from every angle.
Try It Now
Test your knowledge
Our approach aligns with the evidence
Exam Scores
Better Recall
Less Anxiety
Statistics Topics
1. Basic Concepts
2. Data Representation
3. Data Interpretation
4. Discrete Probabilities
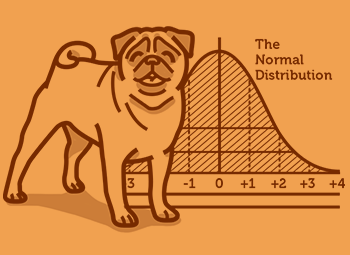
5. Normal Distribution and Z-score
6. Confidence Intervals
7. Combinatorics
8. Probability
9. Set Theory
10. Hypothesis Testing
10 Chapters · 62 Topics · 516 Videos
Discover Our Learning Areas
Explore key subjects and start learning with interactive content.


What is University Statistics?
University Statistics is the study of how to collect, analyse, interpret, and present data. It gives you the tools to make evidence-based decisions under uncertainty — a skill valued across virtually every academic discipline and professional field. In a single semester of introductory Statistics you move from organising raw data to testing scientific hypotheses and modelling relationships between variables.
Statistics sits at the intersection of mathematics and applied reasoning. Unlike pure mathematics, where a correct proof settles the matter, Statistics requires you to judge how confident you can be in a conclusion given imperfect data. That interpretive layer is what makes the course both challenging and genuinely useful.
What topics are covered in University Statistics?
A standard introductory Statistics unit at an Australian university is structured in three broad phases. The first phase covers descriptive statistics: summarising data with measures of centre (mean, median, mode) and spread (variance, standard deviation, interquartile range), and visualising distributions with histograms, box plots, and scatter plots.
The second phase introduces probability theory: sample spaces, the addition and multiplication rules, conditional probability, and Bayes' theorem. From there you study discrete and continuous probability distributions — the binomial, Poisson, and normal distributions are covered in almost every unit. The central limit theorem, which underpins nearly all of inferential statistics, is introduced here.
The third phase is inferential statistics: confidence intervals, hypothesis testing (one-sample and two-sample t-tests, chi-square tests, one-way ANOVA), and simple and multiple linear regression. Many units end with an introduction to non-parametric tests or basic time-series analysis. Statistical software — typically R, SPSS, or Excel — is integrated throughout assignments.
Is Statistics hard for university students in Australia?
Many students find Statistics more difficult than they expected — not because the formulas are mathematically advanced, but because the course demands two kinds of thinking simultaneously: precise calculation and careful interpretation. You can compute a p-value correctly and still misinterpret what it means, which costs marks on exams and assignments.
The topics that cause the most difficulty are hypothesis testing (especially understanding what a p-value actually measures), selecting the correct test for a given research question, and interpreting regression coefficients in plain language. Students who struggle most are often those who revise passively by re-reading lecture slides rather than actively working through practice problems under time pressure.
The encouraging reality is that Statistics rewards consistent, structured practice more than raw mathematical talent. Students who attempt varied problems — including ones they have not seen before — build the pattern recognition that exam questions test.
How is Statistics assessed at Australian universities?
Assessment structures vary across institutions but the most common pattern includes: weekly or fortnightly online quizzes worth 10–20% of the final grade; one or two data analysis assignments involving statistical software, worth 20–30%; a mid-semester exam covering descriptive statistics and probability, worth 20–30%; and a final exam spanning the full course, typically worth 40–50%.
Some units weight the final exam more heavily — up to 60% — making thorough exam preparation essential. Australian university grades are reported on a 0–100 scale and typically map to: Fail (0–49), Pass (50–64), Credit (65–74), Distinction (75–84), and High Distinction (85–100). Understanding how your unit weights each assessment helps you allocate study time strategically rather than treating all topics equally.
Why StudyPug for Statistics?
StudyPug is built around three principles that directly address how students actually struggle with Statistics.
Diagnostic assessment first. Rather than asking you to work through the entire topic list, StudyPug's diagnostic identifies exactly which concepts are causing problems. If you have a solid grip on descriptive statistics but are losing marks on hypothesis testing, you focus on hypothesis testing — not on reviewing material you already understand. That efficiency matters when mid-semester exams arrive quickly.
Certified-teacher video lessons that teach the method. Every Statistics video lesson on StudyPug is created by experienced, certified teachers — not generated by AI. The lessons are designed to teach you the reasoning behind each technique, not just the steps to reproduce an answer. When you understand why you set up H₀ and H₁ the way you do, you can adapt to exam questions you have never seen before. You can watch lessons as many times as you need until the concept genuinely clicks.
Adaptive practice that adjusts to you. Once you start practising, StudyPug's adaptive system adjusts question difficulty based on your performance. If you are getting questions right consistently, difficulty increases to keep you growing. If you are making errors, the system steps back to reinforce the foundation before moving forward. This means every practice session is genuinely productive — you are always working at the level that builds your skills fastest.
One subscription covers all courses — Statistics, Calculus I–III, Linear Algebra, Differential Equations, and more — so if your degree requires multiple quantitative subjects you are not paying separately for each one.
What you learn: Statistics topic coverage on StudyPug
StudyPug's Statistics content covers the full scope of a standard Australian university introductory Statistics course. Topic areas include:
- Descriptive statistics: mean, median, mode, variance, standard deviation, IQR, data visualisation
- Probability fundamentals: sample spaces, addition and multiplication rules, conditional probability, Bayes' theorem
- Probability distributions: binomial, Poisson, normal, and the central limit theorem
- Sampling and estimation: point estimates, confidence intervals for means and proportions
- Hypothesis testing: one-sample t-test, two-sample t-test, paired t-test, chi-square tests, one-way ANOVA
- Correlation and regression: scatter plots, Pearson's r, simple linear regression, interpretation of coefficients and R²
- Introduction to multiple regression and model diagnostics
Each topic includes video lessons, worked examples, practice problems, and quiz assessments. Mock exams are available for mid-semester and final exam preparation — structured to match the format and time pressure of Australian university assessments.
How to use StudyPug for Statistics
The most effective way to use StudyPug for Statistics is to integrate it with your regular study schedule rather than saving it for the week before exams.
Start with the diagnostic. Before your first week of lectures is over, run the Statistics diagnostic. It takes a short time and gives you a clear picture of where your existing knowledge has gaps. Use that output to prioritise which topics to address first.
Watch the lesson before attempting practice. For a new topic — say, hypothesis testing with a two-sample t-test — watch the video lesson first. Pause and work through the example alongside the instructor. Then attempt practice problems independently before checking the solutions.
Use practice tests before each assessment. StudyPug's Statistics practice tests and mock exams are particularly useful in the two weeks before mid-semester exams and finals. Treat each practice test as a real exam: set a timer, work without notes, then review every question you got wrong using the step-by-step solutions.
Return to weak topics after assessments. After each quiz or assignment, note which topics cost you marks. Use StudyPug to revisit those concepts before they compound into larger gaps. Statistics is a cumulative subject — hypothesis testing builds on probability distributions, which build on descriptive statistics. Gaps compound quickly if left unaddressed.
StudyPug is available on mobile, so you can work through practice problems or rewatch a video explanation between classes, during a commute, or late at night before an exam. Free daily practice content is available without a subscription — a practical way to stay consistent on days when you have limited study time.
Statistics FAQ
Unsure how StudyPug works? Need help with setting up? Check our frequently asked questions or contact us for help.
What do you learn in Statistics, and what topics does it cover?
University Statistics covers the foundations of data analysis and inference. Core topics include descriptive statistics (mean, median, variance), probability theory, probability distributions (normal, binomial, Poisson), sampling methods, confidence intervals, hypothesis testing (t-tests, ANOVA, chi-square), correlation, and regression analysis. Later units may extend into multiple regression, non-parametric methods, and introductory Bayesian reasoning. By the end of the course you can analyse real datasets, draw valid conclusions, and communicate uncertainty clearly — skills applied across science, commerce, and research.
What is the difference between Statistics and a Data Science or Econometrics course?
Introductory Statistics focuses on fundamental probability theory, inference, and classical hypothesis testing — the conceptual foundation every quantitative discipline builds on. Data Science extends those tools with programming, machine learning, and large-scale data wrangling. Econometrics applies regression and time-series methods specifically to economic data, adding concerns like heteroskedasticity and endogeneity. If you struggle with Statistics fundamentals, that difficulty will follow you into Data Science and Econometrics — so getting Statistics right first pays dividends across your degree.
What are the prerequisites for Statistics, and what course comes after it?
Most Australian university Statistics courses require Year 12 Mathematics Methods or equivalent — comfort with algebra, functions, and basic probability is assumed. Some degrees accept Mathematical Applications but may require a bridging module. After introductory Statistics, common progressions include Applied Statistics, Regression Modelling, Multivariate Analysis, or Econometrics depending on your major. In science and health degrees, Biostatistics typically follows. Completing introductory Statistics with a solid understanding of inference makes every downstream quantitative course significantly more manageable.
Is Statistics hard, and where do students struggle most?
Statistics is widely considered one of the more conceptually challenging first-year courses because it requires both mathematical precision and interpretive reasoning — two very different skills. Students most commonly struggle with hypothesis testing logic (understanding p-values and Type I/II errors), choosing the correct test for a given scenario, and interpreting regression output. Probability distributions cause early-semester difficulty, especially the normal distribution and z-scores. The good news: these are learnable with practice. Students who work through varied practice problems — not just re-reading notes — tend to improve noticeably before mid-semester exams.
How is Statistics assessed at Australian universities — mid-semester exams, finals, and assignments?
Assessment varies by institution but the typical structure at Australian universities includes weekly or fortnightly online quizzes (10–20%), one or two written assignments involving data analysis (20–30%), a mid-semester exam covering probability and descriptive statistics (20–30%), and a final exam worth 40–50% that spans the full course. Some units use a practical component with statistical software such as R or SPSS. Performing well on mid-semester exams and staying current with quizzes significantly eases pressure before the final exam period (ATAR equivalent: graded on a 0–100 scale converting to a final grade).
What is one of the hardest topics in Statistics, and how do you approach it?
Hypothesis testing is consistently the topic students find hardest — not because the mechanics are complex, but because the logic is counterintuitive. You are testing evidence against a null hypothesis, not proving your claim directly. The approach that works: start by writing out H₀ and H₁ explicitly before touching any formula. Identify the test type (one-sample t, two-sample t, chi-square, ANOVA) by asking what you are comparing and how many groups exist. Calculate the test statistic step by step, find the p-value, and then interpret it in plain language. Practising varied examples — not just repeating the same test — builds the judgment needed for exam questions.

