AP Statistics Help — Video Lessons & Practice
Get clear explanations for any AP Statistics problem and build exam-ready confidence.

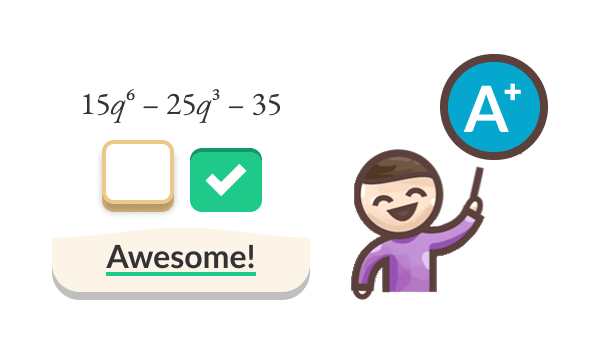
Step-by-Step Video Lessons
Watch concepts explained then solve similar problems.
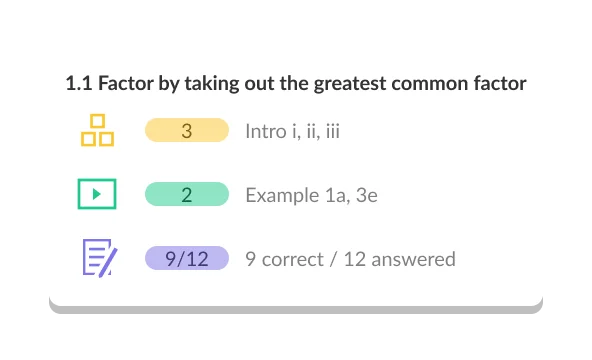
Build Mastery
You actually master it before test day.

Real Exam Practice
Practice real AP Statistics exam questions.
Try It Now
Test your knowledge
Our approach aligns with the evidence
Exam Scores
Better Recall
Less Anxiety
AP Statistics Topics
1. Basic Concepts
2. Data Representation
3. Data Interpretation
4. Probability
5. Set Theory
6. Discrete Probabilities
7. Normal Distribution and Z-Scores
8. Confidence Intervals
9. Hypothesis Testing
9 Chapters · 50 Topics · 394 Videos
Discover Our Learning Areas
Explore key subjects and start learning with interactive content.











What is AP Statistics?
AP Statistics is a college-level mathematics course offered through the College Board that introduces students to the major concepts and tools for collecting, analysing, and drawing conclusions from data. In one sentence: AP Statistics teaches you how to reason with data — from designing a study to interpreting the results of a significance test. The course is structured around four broad themes: exploring data, sampling and experimentation, probability and random variables, and statistical inference. Students who complete AP Statistics and score well on the May exam may earn university credit, giving them a genuine academic advantage before they even begin tertiary study.
What topics are covered in AP Statistics?
AP Statistics is built around a logical progression from describing data to making decisions based on it. The exploring data unit covers univariate and bivariate data analysis — histograms, boxplots, scatterplots, correlation, and least-squares regression lines. The sampling and experimentation unit examines how well-designed studies produce trustworthy data, covering sampling methods, experimental design, and the concept of bias. The probability unit introduces random variables, binomial and geometric distributions, the normal distribution, and combining random variables. The final and most heavily weighted unit — statistical inference — covers confidence intervals and significance tests for proportions and means, chi-square tests, and inference for regression. Together these units prepare students for every question type on the AP exam.
Is AP Statistics hard?
AP Statistics sits in the moderate range of AP course difficulty. The underlying mathematics is not as technically demanding as AP Calculus — you do not need calculus to succeed. The real challenge is conceptual precision: AP Statistics requires students to write answers in exact, careful language, particularly during inference tasks. A response that is mathematically correct but poorly worded can lose marks. Common struggle points include interpreting p-values without overstating what they prove, writing correct null and alternative hypotheses, checking all required conditions before running a test, and distinguishing between correlation and causation. Students who approach statistics as a reading-and-reasoning subject — not just a calculation exercise — tend to perform strongest on the free-response section.
What comes before and after AP Statistics?
Most students take AP Statistics in Year 11 or Year 12 after completing at least one year of algebra-based mathematics. Prior calculus experience is not required, which makes AP Statistics a realistic option for students who want a rigorous quantitative course without the calculus pathway. Prerequisites are modest: comfort with algebraic reasoning, reading graphs, and working with percentages is sufficient. After AP Statistics, students are strongly positioned for university courses in statistics, economics, psychology, public health, data science, and any research-heavy discipline. The logical thinking and data literacy skills developed in the course are directly transferable across nearly every field of study.
How is AP Statistics examined in Australia?
AP Statistics is examined through the annual AP Statistics exam, administered each May by the College Board. Australian students typically sit the exam through registered AP exam centres. The exam runs for three hours and consists of two sections: Section I is 40 multiple-choice questions worth 50% of the total score, and Section II is a free-response section worth the other 50%, comprising five shorter questions and one longer investigative task requiring extended statistical reasoning. Scores are reported on a scale of 1 to 5. A score of 4 or 5 is generally required for university credit recognition in Australia, though each institution sets its own policy — it is worth checking with the specific university before the exam.
What is the hardest concept in AP Statistics?
Among the most frequently misunderstood concepts is the correct interpretation of a confidence interval. Students often say a 95% confidence interval means there is a 95% chance the true parameter is in that interval — but this is not accurate. The correct interpretation is that the method, repeated across many samples, would capture the true parameter 95% of the time. Any single interval either contains the parameter or it does not. Closely related is the p-value misconception: a small p-value does not prove the alternative hypothesis is true; it only tells you the observed data would be unlikely if the null were true. Building fluency with these ideas through repeated practice and precise written explanations is the fastest route to confidence in this unit.
Why StudyPug for AP Statistics?
StudyPug is built specifically around the way students actually get stuck — not just in what they do not know, but in how long they spin their wheels figuring that out. The diagnostic assessment identifies your exact gaps in AP Statistics quickly, so you are not re-watching lessons on topics you already understand. From there, certified-teacher video lessons walk through every method step by step — teaching you how to solve the problem, not just showing you the answer. That distinction matters enormously in AP Statistics, where free-response marks depend on your ability to replicate a reasoning process independently under exam conditions.
Adaptive practice then adjusts to your performance in real time, giving you harder or easier problems based on what you have just demonstrated. This keeps practice sessions productive rather than demoralising. The full AP Statistics exam-style practice included in the subscription means you can experience the exam format repeatedly before May, reducing anxiety and building the kind of fluency that only comes from doing many timed problems. StudyPug's 30-day money-back guarantee means there is no risk in starting — and free practice problems are available immediately, no subscription required.
What you learn — AP Statistics curriculum coverage
StudyPug's AP Statistics content follows the College Board curriculum framework across all four major units. The video lessons and practice problems cover:
- Exploring data: one-variable and two-variable data analysis, normal distributions, least-squares regression, residuals, and outlier identification.
- Sampling and experimentation: simple random samples, stratified and cluster sampling, completely randomised experiments, blocking, and sources of bias.
- Probability and random variables: basic probability rules, conditional probability, independence, binomial and geometric distributions, the Central Limit Theorem, and combining distributions.
- Statistical inference: confidence intervals for proportions and means, one-sample and two-sample significance tests, chi-square goodness-of-fit and independence tests, and inference for the slope of a regression model.
Every topic is supported by video lessons that mirror the AP exam's question style, practice problems with worked solutions, and exam-style free-response practice. Because this page's internal link map currently has no validated topic-level URLs for this course, browse all available AP Statistics topics directly from the topic list on this page.
Using StudyPug for AP Statistics
The most effective StudyPug workflow for AP Statistics students starts with the diagnostic. Run it before anything else — it takes only a few minutes and produces a personalised list of topics ranked by how much attention they need. Work through the recommended video lessons in that order. Each lesson teaches the method first, then demonstrates it through worked examples that match the style of AP exam questions. After each lesson, complete the adaptive practice set for that topic. The platform adjusts difficulty based on your responses, so if you are getting questions right consistently, it moves you forward; if you are struggling, it holds you in the topic a little longer with different problem types.
As the AP exam approaches, shift to exam-style practice tests. These simulate the actual exam format — timed multiple-choice followed by free-response questions — and come with full video solution walkthroughs so you can see exactly where your written reasoning diverged from the expected approach. Use Photo Search to snap a picture of any AP Statistics problem you are stuck on and find the matching lesson instantly. This is particularly useful during homework or self-study when you cannot immediately identify which concept applies. StudyPug is available on any device, so you can watch a lesson, practise, and review solutions whether you are at your desk or on the go.
AP Statistics FAQ
Unsure how StudyPug works? Need help with setting up? Check our frequently asked questions or contact us for help.
What do you learn in AP Statistics, and what topics does it cover?
AP Statistics covers four main areas: exploring data (describing patterns using graphs and numerical summaries), sampling and experimentation (how data is collected and designed), probability and simulation (random variables and probability models), and statistical inference (confidence intervals and significance tests). By the end of the course, students can draw meaningful conclusions from data and communicate findings clearly — skills tested directly on the AP Statistics exam in May.
What is the difference between AP Statistics and AP Calculus?
AP Statistics focuses on collecting, analysing, and interpreting data using probability and inference. AP Calculus focuses on rates of change and accumulation through differential and integral calculus. Statistics is more about reasoning with uncertainty; calculus is about mathematical functions and their behaviour. Many students take both, but they develop very different skills. Statistics is often considered more accessible for students who prefer reasoning and real-world application over pure algebraic manipulation.
Is AP Statistics hard, and where do students struggle most?
AP Statistics is considered moderately challenging. The concepts are logical, but the precise wording required in written responses trips many students up — especially in inference, where you must state hypotheses, check conditions, and interpret results in exact language. Hypothesis testing and understanding the meaning of a p-value are the most common sticking points. Students who struggle often do so not because the maths is difficult but because they underestimate how much clear statistical communication matters on the exam.
What should I take before AP Statistics, and what comes after it?
A solid foundation in algebra and some exposure to data representation (such as Year 10 or 11 mathematics) is enough to begin AP Statistics. Calculus is not required. After AP Statistics, students are well-prepared for university-level statistics, data science, psychology research methods, economics, and any discipline that involves quantitative analysis. A score of 3 or above on the AP exam may earn university credit at many Australian and international universities that recognise AP qualifications.
Is AP Statistics on the AP exam, and how is it tested?
Yes — AP Statistics culminates in the AP Statistics exam, administered each May by the College Board. The exam is three hours long and has two sections: a 40-question multiple-choice section (50% of the score) and a free-response section with five shorter questions plus one investigative task (50% of the score). Scores range from 1 to 5. For students in Australia, a score of 4 or 5 is typically needed for university credit recognition, though policies vary by institution.
What is one of the hardest concepts in AP Statistics, and how do you tackle it?
Interpreting confidence intervals correctly is one of the most commonly misunderstood concepts. A 95% confidence interval does not mean there is a 95% probability the true parameter falls in that specific interval — it means the method produces intervals that capture the true parameter 95% of the time across many samples. To tackle this, practise writing interpretations in plain language, use simulation activities to build intuition, and work through multiple examples with varied contexts. StudyPug's step-by-step inference lessons walk through exactly this kind of nuanced explanation.





Written by the StudyPug Team
Last updated June 5, 2026
3 M+
students
★★★★★
4.8 average
K–12
all grades