Statistics Help: Video Lessons & Practice
Work through every topic with clear solutions. Start your free practice test now!

Certified-Teacher Concept Videos
Our experienced instructors explain the method behind every Statistics topic — not just the answer — so you understand deeply and stay ready for your next course.

Diagnostic Assessment & Adaptive Practice
A quick diagnostic pinpoints exactly where to focus, then practice difficulty adjusts to your level — so every session moves you forward, not over ground you already know.
Full Statistics Course Coverage
From descriptive statistics and probability to hypothesis testing and regression — all topics in one subscription, with mock exams ready for your A-Level and university assessments.
Try It Now
Test your knowledge
Our approach aligns with the evidence
Exam Scores
Better Recall
Less Anxiety
Statistics Topics
1. Basic Concepts
2. Data Representation
3. Data Interpretation
4. Discrete Probabilities
5. Normal Distribution and Z-score
6. Confidence Intervals
7. Combinatorics
8. Probability
9. Set Theory
10. Hypothesis Testing
10 Chapters · 62 Topics · 516 Videos
Discover Our Learning Areas
Explore key subjects and start learning with interactive content.


What is Statistics?
Statistics is the science of collecting, organising, analysing, and interpreting numerical data to support decision-making under uncertainty. It underpins virtually every field — from medical research and economics to engineering and social science — making it one of the most transferable and in-demand skill sets a student can develop.
At A-Level and university level in the UK, Statistics moves well beyond basic data summaries. Students learn to apply formal inferential methods, build and evaluate probabilistic models, and communicate quantitative findings with precision. Whether you are studying towards your A-Level examinations or working through a university module, a thorough understanding of statistical reasoning is the foundation of everything that follows.
How difficult is A-Level and university Statistics?
Statistics has a reputation for being more conceptually demanding than many students expect, even for those who are confident in pure mathematics. The difficulty lies not in complex arithmetic but in statistical reasoning — knowing why you are applying a test, not just how. Common struggle points include correctly formulating hypotheses, interpreting p-values without misreading them as the probability the null hypothesis is true, and choosing the appropriate test or distribution for a given scenario.
The good news is that once the logical structure of inference clicks — null hypothesis, test statistic, critical region, conclusion in context — the pattern repeats across almost every test you will encounter. Regular practice with fully worked solutions is far more effective than re-reading notes, because statistics is a procedural subject that rewards doing over reading.
What are the key topics in A-Level Statistics?
A-Level Statistics in England and Wales (Edexcel, AQA, OCR) covers a well-defined set of core topics. Expect to spend significant time on:
- Probability — conditional probability, Venn diagrams, tree diagrams, independence
- Discrete probability distributions — the binomial distribution, expectation, variance
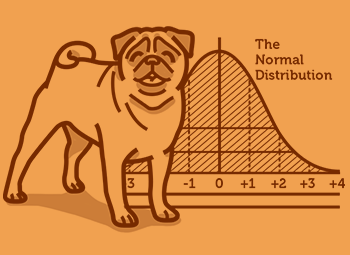
- The normal distribution — standardisation, the z-score, finding probabilities and critical values
- Statistical hypothesis testing — one-tailed and two-tailed tests using the binomial and normal distributions
- Correlation and regression — product-moment correlation coefficient, least-squares regression lines, interpolation and extrapolation
- Sampling and data representation — sampling methods, large data sets (board-dependent), measures of location and spread
University Statistics extends these foundations into multiple regression, ANOVA, chi-squared tests, non-parametric methods, and in many programmes, Bayesian inference and stochastic modelling.
What is hypothesis testing, and why does it matter so much?
Hypothesis testing is the formal procedure for using sample data to make a decision about a population. You state a null hypothesis (the default claim), select a significance level (typically 5% or 1%), collect data, calculate a test statistic, and determine whether your result falls in the critical region. If it does, you reject the null hypothesis in favour of the alternative.
It matters because it appears throughout the A-Level papers and every quantitative university module. Examiners consistently report that students lose marks not on the calculation but on the conclusion — failing to refer back to the context, or confusing the significance level with the probability of a Type I error. Practising full exam-style questions, including the written interpretation, is the most reliable way to close that gap.
How is A-Level Statistics examined?
At A-Level in England, Statistics is assessed through written papers set by your examination board. Under Edexcel, for example, Statistics and Mechanics content appears on Paper 2 and Paper 3 of the A-Level Mathematics qualification. AQA and OCR follow similar structures. There is no standalone coursework component. Papers typically include short calculation questions, multi-part problem-solving questions, and questions requiring written interpretation of results.
At university, assessment is module-specific: most introductory Statistics modules combine an end-of-year written examination with in-semester assessments such as data analysis coursework or computer-based tests using R or SPSS. Checking your module handbook early lets you allocate revision time effectively.
What comes after Statistics at A-Level and university?
After A-Level Statistics (within Mathematics), most students progress to undergraduate degrees in Mathematics, Statistics, Data Science, Economics, or Psychology — all of which draw heavily on statistical methods. At university, introductory Statistics feeds into more specialised modules: Applied Statistics, Biostatistics, Econometrics, Time Series Analysis, and Machine Learning. Each of these builds directly on hypothesis testing, regression, and probability distributions, making a strong A-Level grounding invaluable.
Why use StudyPug for Statistics help?
StudyPug is built around a simple idea: students improve faster when they understand the method, not just the answer. Every Statistics lesson is taught by a certified, experienced teacher who walks through the reasoning step by step — explaining not just the calculation but the logic behind it, so you are prepared for unfamiliar exam questions, not just the ones you have seen before.
The platform starts with a diagnostic assessment that quickly maps your current understanding across Statistics topics. Rather than working through everything from scratch, you focus on the areas where you will gain the most ground. As you practise, the adaptive practice system adjusts difficulty in real time — reinforcing weak areas and progressing when you are ready.
All Statistics content — A-Level through university — is included in a single subscription alongside every other subject. There are no per-course charges. Mock exams and practice tests are structured around the kinds of questions that appear in A-Level papers and university assessments, so your revision is always exam-relevant. Every subscription is backed by a 30-day money-back guarantee.
What Statistics topics does StudyPug cover?
StudyPug covers the full breadth of Statistics content needed for A-Level and university study in the UK. Topic coverage includes:
- Descriptive statistics — measures of central tendency, spread, and data representation
- Probability — rules of probability, conditional probability, independence
- Binomial and normal distributions — calculating probabilities, expectation, and variance
- Hypothesis testing — binomial tests, z-tests, t-tests, chi-squared tests
- Correlation and linear regression — PMCC, regression equations, interpretation
- Sampling methods and statistical inference
- ANOVA and non-parametric tests (university level)
- Introduction to multiple regression and model selection (university level)
Each topic has dedicated video lessons, worked practice problems, and quiz questions. You can move between topics freely — starting wherever you need help rather than following a fixed sequence.
Note: topic page links will appear here once validated URLs are available in the site map.
How to use StudyPug for Statistics revision
The most effective approach combines the diagnostic, the videos, and the practice tests in a structured cycle. Start with the diagnostic assessment to get a clear picture of where you stand. It will surface the topics most worth your time — for most A-Level students, that tends to be hypothesis testing and the normal distribution; for university students, regression and inference.
From there, watch the certified-teacher video lesson for each flagged topic. Pause and re-watch the key steps — the videos are available to view as many times as you need, so you can return to a tricky section until it genuinely makes sense. Follow each video with the accompanying practice problems, letting the adaptive system push difficulty as your confidence grows.
In the final weeks before your A-Level or university exam, use the mock exam papers. Work through them under timed conditions, then review every question — including the ones you got right, to confirm your reasoning is sound and not just accidentally correct. The 30-day money-back guarantee means you can start with full access and assess whether the approach works for you, completely risk-free.
Statistics FAQ
Unsure how StudyPug works? Need help with setting up? Check our frequently asked questions or contact us for help.
What do you learn in Statistics, and what topics does it cover?
Statistics covers collecting, organising, analysing, and interpreting data. Core topics include descriptive statistics (mean, median, standard deviation), probability theory, probability distributions (binomial, normal, Poisson), sampling and estimation, hypothesis testing (t-tests, chi-squared, ANOVA), correlation, and regression analysis. At A-Level and university, you also cover statistical inference, non-parametric tests, and sometimes Bayesian methods. The course builds a toolkit for drawing reliable conclusions from data — essential for any quantitative field.
What is the difference between Statistics and Further Mathematics (or Pure Mathematics)?
Pure Mathematics and Further Mathematics focus on abstract reasoning — calculus, algebra, proof, and complex numbers. Statistics is applied: it uses mathematical tools to model uncertainty and analyse real-world data. At A-Level, Statistics is often a component within Mathematics or Further Mathematics. At university, a standalone Statistics degree goes deeper into probability theory, stochastic processes, and applied modelling, whereas a Mathematics degree covers those topics alongside pure strands. If you enjoy data and inference, Statistics is the more applied route.
What are the prerequisites for Statistics, and what course comes after it?
For A-Level Statistics you need a solid GCSE Mathematics foundation — algebra, basic probability, and data handling. At university level, a strong A-Level Mathematics result (typically grade A or B) is expected. After A-Level Statistics, students progress to university Statistics, Data Science, or quantitative Social Science degrees. After an undergraduate Statistics course, pathways include Applied Statistics, Biostatistics, Econometrics, or Machine Learning modules at postgraduate level.
Is Statistics hard, and where do students struggle most?
Statistics is manageable once the underlying logic clicks, but many students find it harder than expected. The most common sticking points are hypothesis testing (understanding what a p-value actually means and setting up the correct test), choosing the right probability distribution, and interpreting regression output correctly. Students often lose marks by applying a method mechanically without understanding the reasoning. Working through plenty of practice problems with full worked solutions — rather than just reading notes — is the fastest way to build genuine confidence.
How is Statistics assessed — A-Level exams, coursework, and university assessments?
At A-Level in England and Wales, Statistics content is assessed through written examinations (typically two or three papers) set by boards such as Edexcel, AQA, or OCR. There is no standalone coursework for the Statistics component. At university, assessment usually combines mid-term tests or in-semester coursework (data analysis assignments) with a final written examination. Some modules include a practical computing component using software such as R or SPSS. Checking your specific board or module handbook is always recommended.
What is one of the hardest topics in Statistics, and how do you approach it?
Hypothesis testing is consistently the most challenging topic. Students must correctly state null and alternative hypotheses, select an appropriate test statistic, calculate a p-value or critical region, and interpret the result in context — all under exam conditions. The approach that works: start by understanding what question the test is answering, not just the formula. Write out every step methodically. Work through multiple exam-style questions with fully worked solutions, checking not just the arithmetic but the reasoning at each stage. Repeated practice on varied scenarios builds the pattern recognition needed under time pressure.

