AP Statistics Help — Video Lessons & Practice
Get clear explanations for any AP Statistics problem and build exam-ready confidence.

Certified-Teacher Concept Videos
Our certified teachers walk you through every AP Statistics topic step by step — not just the answer, but the method — so you can tackle any similar problem on the exam with confidence.

Diagnostic Assessment & Adaptive Practice
A quick diagnostic pinpoints exactly where your gaps are, so you spend time where it counts. Then adaptive practice adjusts difficulty to your level as you improve.

AP Exam Test Prep Included
Your subscription includes AP-style practice questions and full test prep for the AP Statistics exam — so you go into exam season having already practised under realistic conditions.
Try It Now
Test your knowledge
Our approach aligns with the evidence
Exam Scores
Better Recall
Less Anxiety
AP Statistics Topics
1. Basic Concepts
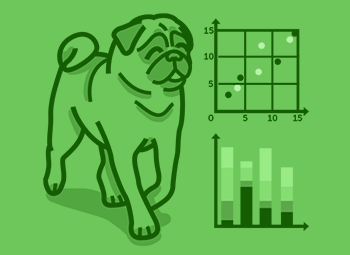
2. Data Representation
3. Data Interpretation
4. Probability
5. Set Theory
6. Discrete Probabilities
7. Normal Distribution and Z-Scores
8. Confidence Intervals
9. Hypothesis Testing
9 Chapters · 50 Topics · 394 Videos
Discover Our Learning Areas
Explore key subjects and start learning with interactive content.


What is AP Statistics?
AP Statistics is a college-level statistics course offered through the College Board's Advanced Placement programme. Students study how to collect, analyse, and draw conclusions from data using probability, inference, and regression — skills directly applicable to university work in social sciences, natural sciences, economics, psychology, and data-driven fields. The course culminates in a single AP exam each May, scored on a 1–5 scale, with results accepted for credit or advanced standing at many universities worldwide.
For UK students, AP Statistics is typically taken alongside or in place of A-Level Mathematics content, and a strong AP score is increasingly valued in applications to both UK and US universities.
What topics are covered in AP Statistics?
The AP Statistics curriculum is organised into four broad conceptual themes:
Exploring Data — describing distributions of one and two variables, summarising data with statistics and graphs, comparing groups, and identifying patterns or unusual features.
Sampling and Experimentation — planning and conducting studies, understanding random sampling, experimental design, bias, and the distinction between observational studies and experiments. This section directly underpins the quality of any statistical inference.
Anticipating Patterns (Probability) — probability rules, random variables, binomial and geometric distributions, and the normal distribution. The Central Limit Theorem is a pivotal concept here.
Statistical Inference — confidence intervals and hypothesis tests for proportions and means (one-sample and two-sample), chi-square tests, and simple linear regression inference. This is the heart of the AP exam's free-response section and the area where most students need the most AP Statistics practice.
Is AP Statistics difficult?
Most students find AP Statistics more accessible than AP Calculus in terms of raw computation, but harder than expected when it comes to conceptual precision and written communication. The exam does not simply reward correct arithmetic — it rewards correct statistical reasoning explained in full sentences using proper terminology.
The concepts students struggle with most are: setting up hypothesis tests correctly (choosing the right test and verifying conditions), interpreting p-values without over-claiming, and writing free-response conclusions that are precise without being ambiguous. Students who practise the four-step inference procedure — hypotheses, conditions, calculations, conclusion — consistently outperform those who learn only the mechanics.
With the right AP Statistics help and regular worked-example practice, the course is very manageable. The key is not just watching solutions but understanding the method well enough to apply it to unfamiliar contexts.
What should I know before taking AP Statistics?
AP Statistics requires Algebra II-level fluency — you need to be comfortable with linear equations, basic function notation, and interpreting graphs. Pre-calculus and calculus are not required. For UK students, strong GCSE Maths or the equivalent provides an excellent foundation.
After AP Statistics, students are well prepared for university introductory statistics, econometrics, biometrics, research methods in psychology or sociology, and quantitative data analysis in any discipline. The statistical literacy developed in this course has practical value across virtually every academic and professional field.
How is AP Statistics assessed?
The AP Statistics exam has two sections of equal weight. Section I is 40 multiple-choice questions completed in 90 minutes, testing breadth across all four conceptual themes. Section II is 90 minutes of free response: five shorter questions (each typically targeting one or two skills) and one extended investigative task that requires sustained statistical reasoning across multiple parts.
The investigative task is worth the same as the five shorter questions combined, which means the ability to write clear, well-structured statistical arguments is critical. Past AP Statistics exams and scoring guidelines are publicly available from the College Board and are an essential revision resource.
Why StudyPug for AP Statistics help?
StudyPug is built around the challenges that actually prevent students from improving in AP Statistics — not just gaps in knowledge, but gaps in understanding the method.
Diagnostic assessment first. Rather than working through material you already understand, StudyPug's diagnostic assessment identifies exactly where your knowledge breaks down. You see a prioritised focus list from day one, which means every study session is efficient rather than scattered.
Certified-teacher video lessons that teach the method. Every AP Statistics video lesson on StudyPug is created by a certified teacher. The lessons do not simply show you a worked answer — they explain why each step is taken, which conditions need to be checked, and how to adapt the approach when the problem changes. This is what helps you transfer understanding to the AP exam, where problems are designed to be slightly different from anything you have practised.
Adaptive practice that grows with you. Once you understand a concept, StudyPug's adaptive practice engine adjusts the difficulty of problems to match your current level. You are neither bored by questions that are too simple nor overwhelmed by questions that are too advanced. The system keeps you in the productive zone where genuine learning happens.
AP exam-style practice included. StudyPug's subscription includes AP Statistics exam prep with practice questions based on the real AP exam format. You practise under conditions that mirror the actual test, including free-response questions that require written statistical justification — the exact skill the AP exam rewards.
Free daily practice, no commitment required. You can try AP Statistics practice problems for free before subscribing. This is genuine practice content, not a locked preview. When you are ready for full access — including all videos, the diagnostic, and adaptive practice — every subscription is backed by a 30-day money-back guarantee.
What you learn: AP Statistics curriculum coverage on StudyPug
StudyPug covers the full AP Statistics curriculum as set by the College Board. Topic coverage includes:
- Displaying and describing distributions (dot plots, histograms, boxplots, stem-and-leaf)
- Measures of centre and spread (mean, median, standard deviation, IQR)
- Scatterplots, correlation, and least-squares regression (including residuals and influential points)
- Transforming data and modelling non-linear relationships
- Designing surveys and experiments (sampling methods, randomisation, control)
- Probability rules, independent and mutually exclusive events
- Discrete and continuous random variables, expected value and variance
- Binomial, geometric, and normal distributions
- The Central Limit Theorem and sampling distributions
- Confidence intervals for one proportion and one mean
- Hypothesis tests for one proportion, one mean, two proportions, two means
- Chi-square tests for goodness of fit, homogeneity, and independence
- Simple linear regression inference (slope, intervals, significance)
Each topic is broken into focused lessons, with examples drawn from real-world contexts similar to those used on the AP exam. No validated internal topic URLs are available in the current link map for this page — browse all AP Statistics topics directly from the StudyPug AP Statistics course page.
How to use StudyPug for AP Statistics
Step 1 — Take the diagnostic. Start with the diagnostic assessment. It takes only a few minutes and produces a clear picture of which AP Statistics topics are solid and which need work. Use this as your study roadmap rather than working through topics in order from beginning to end.
Step 2 — Watch the concept video. For each topic flagged by the diagnostic, watch the certified-teacher video lesson. Pause when the teacher works through a step and try to replicate it before watching the solution. Focus on understanding why, not just what.
Step 3 — Practise adaptively. After each video, complete the adaptive practice questions. The system will increase difficulty as your accuracy improves. For topics like hypothesis testing and confidence intervals, aim to practise writing full conclusions — not just computing the test statistic.
Step 4 — Use Photo Search if you get stuck. If you encounter a problem in your textbook or past-paper practice and cannot identify which lesson covers it, use StudyPug's Photo Search to find the matching lesson instantly. It works across all topics and all grades.
Step 5 — Tackle AP exam prep. In the weeks before your AP exam, switch to the AP Statistics exam prep section. Work through AP-style free-response questions and review the scoring guidance to understand what the College Board is looking for in each answer. This is where the combination of conceptual understanding and practised exam technique pays off.
StudyPug is available on any device, at any time — so whether you study at school, at home, or on the go, your AP Statistics help is always accessible.
AP Statistics FAQ
Unsure how StudyPug works? Need help with setting up? Check our frequently asked questions or contact us for help.
What do you learn in AP Statistics, and what topics does it cover?
AP Statistics covers five main areas: exploring data (describing distributions and relationships), sampling and experimentation (how data is collected), probability and random variables, statistical inference (confidence intervals and hypothesis tests), and regression analysis. You learn to interpret real-world data, draw conclusions from samples, and communicate statistical reasoning clearly. These skills are tested on the AP exam through multiple-choice questions and free-response problems that require both calculation and written explanation.
What is the difference between AP Statistics and AP Calculus?
AP Statistics focuses on collecting, analysing, and interpreting data using probability and inference. It requires logical reasoning and clear written explanations more than complex computation. AP Calculus, by contrast, studies continuous change through differentiation and integration and is more algebraically demanding. Statistics suits students interested in social sciences, biology, economics, or psychology; Calculus suits those heading toward engineering, physics, or pure mathematics. Many sixth-form students take both, but they draw on very different ways of thinking.
Is AP Statistics hard, and where do students struggle most?
AP Statistics is considered moderately challenging. Most students find the concepts approachable at first but struggle when topics combine — for example, understanding when to use a t-test versus a z-test, or correctly setting up and interpreting a hypothesis test in written form. Confidence intervals and the logic of p-values are the most common sticking points. The free-response section of the AP exam also demands precise statistical language, which takes practice. Consistent review and worked examples make a significant difference.
What should I take before AP Statistics, and what comes after it?
A solid foundation in Algebra II or equivalent is sufficient preparation for AP Statistics — you do not need pre-calculus. Students who have studied A-Level Mathematics or a strong GCSE maths course will find the transition smooth. After AP Statistics, natural progressions include university-level introductory statistics, econometrics, data science, or research methods in social and natural sciences. The course is widely recognised by UK universities as strong evidence of analytical ability when included in an application.
Is AP Statistics on the AP exam, and how is it tested?
Yes. The AP Statistics exam is set by the College Board and taken each May. It consists of a 90-minute multiple-choice section (40 questions) and a 90-minute free-response section (five short questions plus one investigative task). The exam is scored on a 1–5 scale; a score of 3 or above is generally considered passing. Many UK students sit AP exams alongside A-Levels to strengthen their US university applications. The entire AP Statistics curriculum is tested, with particular emphasis on inference and experimental design.
What is one of the hardest concepts in AP Statistics, and how do you tackle it?
Hypothesis testing — particularly interpreting p-values and making correct conclusions — is consistently rated the hardest concept in AP Statistics. Students often confuse 'failing to reject the null hypothesis' with 'proving the null is true,' which is a common exam error. The key is to practise writing conclusions in context, using the four-step inference procedure (hypotheses, conditions, calculations, conclusion) on a wide range of scenarios. Working through AP free-response questions from past exams and reviewing each step against the scoring guidelines is the most effective preparation strategy.

