Statistics Help: Video Lessons & Practice
Work through every topic with clear solutions. Start your free practice test now!
Value vs. Private Tutor
Affordable expert statistics help online.
Multi-Subject
Switch subjects anytime under one plan.
Practice Until Perfect
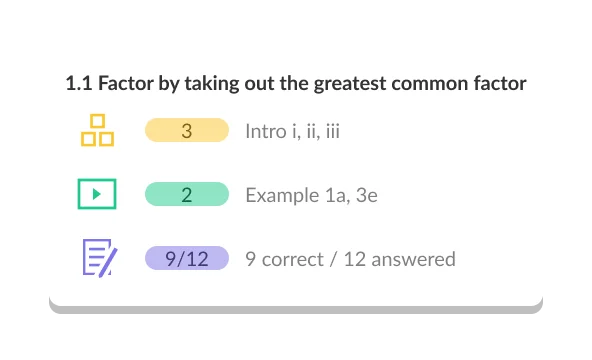
You practice until it truly clicks.
Try It Now
Test your knowledge
Our approach aligns with the evidence
Exam Scores
Better Recall
Less Anxiety
Statistics Topics
1. Basic Concepts
2. Data Representation
3. Data Interpretation
4. Discrete Probabilities
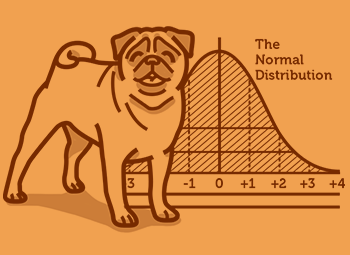
5. Normal Distribution and Z-score
6. Confidence Intervals
7. Combinatorics
8. Probability
9. Set Theory
10. Hypothesis Testing
10 Chapters · 62 Topics · 516 Videos
Discover Our Learning Areas
Explore key subjects and start learning with interactive content.


What is Statistics?
Statistics is the branch of mathematics concerned with collecting, organising, analysing, and interpreting data to support decision-making under uncertainty. At NCEA Level 3 and in first-year university courses in New Zealand, Statistics teaches you to move from raw numbers to meaningful conclusions — a skill valued across health sciences, economics, psychology, engineering, and virtually every data-driven field.
The core question Statistics answers is: given the data I have, what can I reasonably conclude about the broader population — and how confident should I be? Learning to answer that question rigorously is what the course is fundamentally about.
What do you actually study in a Statistics course?
A typical NCEA Level 3 or introductory university Statistics course moves through several interconnected areas. You begin with descriptive statistics — summarising data using measures of centre (mean, median, mode) and spread (range, interquartile range, standard deviation, variance). You then study probability: calculating the likelihood of events, understanding independent and conditional probability, and working with probability rules.
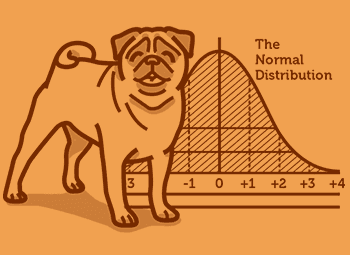
From there the course moves into probability distributions. The normal distribution is central — you learn to standardise values using z-scores, use the standard normal table, and apply the distribution to real problems. You also cover the binomial and Poisson distributions. The second half of the course focuses heavily on statistical inference: constructing confidence intervals for population parameters, and conducting hypothesis tests to decide whether sample evidence supports or contradicts a claim about a population. Regression and correlation — measuring and modelling the relationship between two variables — typically round out the core content. At Year 13 NCEA level you will also work on time series analysis and formal statistical investigations.
Is Statistics harder than other mathematics courses?
Students often find Statistics unexpectedly difficult compared to courses like Calculus, not because the arithmetic is harder but because it demands a different kind of thinking. In Calculus, a correct procedure produces a correct answer. In Statistics, you must also interpret your result in the context of the original question — and that interpretive step is where many students lose marks.
The topics students consistently find most challenging are hypothesis testing (particularly understanding what a p-value means and does not mean), confidence intervals (a common misconception is that a 95% confidence interval means there is a 95% chance the true parameter lies inside it — this is not correct), and choosing the right probability distribution for a given scenario. The good news: these difficulties are predictable, which means targeted practice on exactly these areas is highly effective. StudyPug's diagnostic assessment identifies which of these pressure points apply to you specifically, so your study time goes to where it will make the biggest difference.
How is Statistics assessed in New Zealand?
At NCEA Level 3, Statistics assessment is divided between internal and external components. Internal standards are submitted throughout the school year and typically include investigations such as a time series analysis, a bivariate data investigation, and a formal statistical inference task using real data. These standards are assessed by your teacher and moderated by NZQA. External assessment takes place in the November NCEA examination, which tests probability, distributions, and inference under timed conditions.
At university level, statistics papers are usually assessed through a combination of fortnightly assignments or labs, an in-semester test or mid-semester examination, and a final examination that carries significant weight. Some courses include a data analysis project. StudyPug's practice tests are structured based on real assessment formats, giving you the closest possible preparation experience for both NCEA and university statistics examinations.
What comes before and after Statistics — prerequisites and progression?
To succeed at NCEA Level 3 Statistics you should be comfortable with NCEA Level 2 Mathematics or Statistics — particularly algebra, plotting and interpreting graphs, and introductory probability. At university, most introductory statistics courses assume only secondary school mathematics and are accessible to students from a wide range of degree programmes.
After Year 13 Statistics or a first-year university statistics course, common progression paths include Statistical Inference, Regression Modelling, Probability Theory, Bayesian Statistics, Biostatistics, Econometrics, and introductory Data Science. A strong foundation in Statistics opens doors not just in mathematics but across every discipline that works with data — which, increasingly, is almost all of them.
Why use StudyPug for Statistics?
StudyPug is built around one core idea: understanding the method, not just memorising procedures. Every Statistics lesson is taught by a certified, experienced teacher — not generated by AI. The videos walk through the reasoning behind each concept step by step, so when you encounter an unfamiliar question in your NCEA assessment or university examination, you have the understanding to work through it rather than just pattern-matching to a formula you half-remember.
The platform starts you with a diagnostic assessment that identifies your specific gaps — so if you are already solid on descriptive statistics but struggling with inference, you go straight there. Adaptive practice then adjusts difficulty in real time as you improve, which means you are always working at the level that builds your skills most efficiently. You can watch any lesson an unlimited number of times, which is particularly valuable for dense topics like hypothesis testing where one pass is rarely enough.
One subscription covers all statistics courses — introductory through advanced — as well as every other subject on the platform. Whether you are preparing for NCEA Level 3 internal assessments, revising for the November external examination, or working through a first-year university statistics paper, everything you need is in one place. And if StudyPug is not right for you, the 30-day money-back guarantee means you can try it risk-free.
What Statistics topics does StudyPug cover?
StudyPug's Statistics content covers the full range of topics you encounter at NCEA Level 3 and university level in New Zealand, including:
- Descriptive statistics: mean, median, mode, standard deviation, variance, IQR
- Probability: rules, conditional probability, independence, Bayes' theorem
- Probability distributions: normal, binomial, Poisson, t-distribution
- Sampling methods and sampling distributions
- Confidence intervals for means and proportions
- Hypothesis testing: one-sample, two-sample, chi-squared, ANOVA
- Correlation and linear regression: fitting, interpreting, residual analysis
- Time series analysis
- Statistical inference and formal investigation
Because validated topic-page URLs for this course are not yet available in our sitemap feed, internal topic links are not included here. You can browse the full topic list directly from the Statistics course page on StudyPug.
How to use StudyPug for Statistics effectively
The most effective approach combines the diagnostic, video lessons, and practice in a structured sequence. Start with the diagnostic assessment to find out which topics need the most attention. Watch the certified-teacher concept video for that topic — pause, rewind, and re-watch the worked examples until the method makes sense, not just the final answer. Then move to the adaptive practice problems for that topic: work through them until the difficulty stops increasing, which signals genuine understanding rather than surface familiarity.
For NCEA internal assessments, use the platform's practice investigations and worked examples to develop your statistical writing — particularly the interpretive language NZQA rewards in formal inference tasks. For the November external examination and university exams, use the full mock exams under timed conditions. Review every question you get wrong using the step-by-step solution, identify whether the error was procedural or conceptual, and revisit the relevant lesson if needed. Consistent short sessions — practising a little every day — will outperform last-minute cramming for a course that rewards cumulative understanding as much as Statistics does.
Statistics FAQ
Unsure how StudyPug works? Need help with setting up? Check our frequently asked questions or contact us for help.
What do you learn in Statistics, and what topics does it cover?
Statistics covers how to collect, analyse, and interpret data. Key topics include descriptive statistics (mean, median, standard deviation), probability theory, probability distributions (normal, binomial, Poisson), sampling methods, confidence intervals, hypothesis testing, correlation, and regression analysis. At Year 13 NCEA Level 3 and early university level, you will also encounter time series, statistical inference, and introduction to multivariate analysis. The course builds both mathematical reasoning and practical data skills used across science, business, health, and social sciences.
What is the difference between Statistics and Mathematics with Calculus?
Statistics focuses on data, uncertainty, and inference — you learn to draw conclusions from real-world datasets and quantify how confident you are in those conclusions. Mathematics with Calculus focuses on continuous change, functions, derivatives, and integrals. While both courses require algebraic skills, Statistics emphasises probabilistic reasoning and interpretation, whereas Calculus emphasises analytical and symbolic manipulation. Many students take both at NCEA Level 3; Statistics is often considered more applied and is directly relevant to health sciences, social research, economics, and psychology.
What are the prerequisites for Statistics, and what course comes after it?
For NCEA Level 3 Statistics, a solid grounding in NCEA Level 2 Mathematics or Statistics is expected — particularly algebra, graphing, and basic probability. At university level, introductory Statistics typically requires only secondary school mathematics. After completing Year 13 or first-year university Statistics, students progress to courses such as Statistical Inference, Regression Modelling, Probability Theory, Biostatistics, or Econometrics, depending on their degree. Strong statistics skills also directly support courses in data science, psychology research methods, and epidemiology.
Is Statistics hard, and where do students struggle most?
Many students find Statistics conceptually challenging because it requires both mathematical precision and interpretive reasoning. The most common difficulty areas are hypothesis testing (understanding p-values and when to reject the null hypothesis), confidence intervals (what they actually mean), probability distributions (choosing and applying the right one), and regression analysis (interpreting coefficients and residuals). Students who struggled with algebra or who expect pure calculation often find the interpretation-heavy questions unexpected. Consistent practice with varied problems and worked examples is the most effective way to build confidence in these areas.
How is Statistics assessed in New Zealand — NCEA and university exams?
At NCEA Level 3, Statistics is assessed through a mix of internally assessed standards (such as time series, bivariate data investigations, and formal inference) and an external examination sat in November. Internal assessments are submitted throughout the year and count towards your NCEA Level 3 certificate. At university level, assessment typically includes assignments, in-class tests, a mid-semester test, and a final examination. Some courses also include lab reports or data-analysis projects. StudyPug's practice tests and mock exams are designed based on real assessment structures to help you prepare for both NCEA and university statistics examinations.
What is one of the hardest topics in Statistics, and how do you approach it?
Hypothesis testing is consistently the topic students find most difficult. The challenge is that it requires understanding a chain of logic: state null and alternative hypotheses, choose the correct test statistic, calculate it, find the p-value, then interpret the result in context rather than just producing a number. A strong approach is to practise the full procedure on many different scenarios — one-sample t-tests, two-sample tests, chi-squared tests — until the logic becomes automatic. Focus on what the p-value represents (the probability of observing your result if the null hypothesis were true), and always write your conclusion in plain language tied to the original question.





Written by the StudyPug Team
Last updated June 5, 2026
3 M+
students
★★★★★
4.8 average
K–12
all grades