College Statistics Help: Video Lessons & Practice
Work through every topic with clear solutions. Start your free practice test now!

Value vs. Private Tutor
Expert help at a fraction of the cost.

Multi-Subject
Switch to any subject whenever you need.
Build Mastery
Stop moving on before it clicks.
Try It Now
Test your knowledge
Our approach aligns with the evidence
Exam Scores
Better Recall
Less Anxiety
College Statistics Topics
1. Basic Concepts
2. Data Representation
3. Data Interpretation
4. Probability
5. Set Theory
6. Discrete Probabilities
7. Normal Distribution and Z-Scores
8. Confidence Intervals
9. Hypothesis Testing
9 Chapters · 54 Topics · 423 Videos
Discover Our Learning Areas
Explore key subjects and start learning with interactive content.









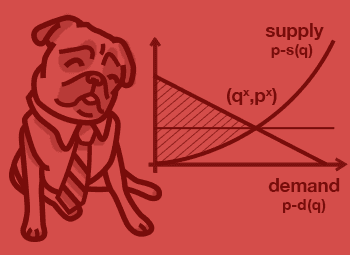


What Is College Statistics?
College Statistics is the study of how to collect, summarise, analyse, and draw conclusions from data. It is a core course across science, business, health, social science, and engineering programmes — and it forms the quantitative backbone of research and decision-making in virtually every field. In a New Zealand university context, College Statistics is typically taken in the first or second year and builds directly toward more advanced courses in applied data analysis, econometrics, and research methods.
At its heart, College Statistics teaches you to ask the right question of a dataset, choose the right method to answer it, and communicate your findings clearly. That combination of critical thinking and technical skill is what makes it both challenging and genuinely useful beyond the classroom.
What Topics Are Covered in College Statistics?
College Statistics courses cover a broad range of interconnected topics. Most courses begin with descriptive statistics — mean, median, mode, standard deviation, and data visualisation — before moving into probability theory, including probability rules, conditional probability, and independence.
From there, courses build toward probability distributions such as the normal, binomial, and Poisson distributions, followed by sampling and estimation, including confidence intervals. The second half of a typical course focuses heavily on hypothesis testing — t-tests, z-tests, chi-square tests, and ANOVA — and concludes with correlation and regression analysis, including simple and multiple linear regression.
Some courses also introduce statistical software (R, SPSS, or Excel), non-parametric methods, and basic experimental design. Coverage varies by programme, but the core inferential toolkit is consistent across New Zealand universities.
Is College Statistics Hard? Where Do Students Struggle?
College Statistics is demanding in a specific way: it is not purely computational, and it is not purely conceptual — it requires both at once. Many students find the calculations straightforward but struggle to interpret what the numbers actually mean. Others understand the ideas but freeze when they need to select the correct test under exam conditions.
The most common struggle points are:
- Hypothesis testing logic — understanding what a p-value represents and how to interpret it in context without confusing statistical significance with practical importance.
- Choosing the right test — knowing when to use a t-test versus ANOVA versus chi-square, and why.
- Regression interpretation — reading regression output and explaining coefficients in plain language.
- Probability setup — translating a word problem into the correct probability calculation.
The students who do well are typically those who work through practice problems consistently rather than relying on notes alone. Seeing worked solutions — particularly ones that explain why each step is taken, not just what the answer is — builds the pattern recognition that makes exam questions manageable.
How Is College Statistics Assessed in New Zealand?
At New Zealand universities, College Statistics is typically assessed through a combination of internal work and a final examination. Internal assessment usually includes assignments or lab reports (often 30–40% of the total grade), which may require statistical software outputs alongside written interpretation. One or two in-semester tests cover material up to that point and give you a mid-course checkpoint.
The final examination is cumulative and usually demands both calculation and interpretation. Questions are often scenario-based — you are given a dataset or research context and asked to select the right method, apply it, and explain the result. Practising exam-style problems under timed conditions, and reviewing the kinds of interpretation questions that appear in past papers, is the most effective preparation strategy for the final.
Why StudyPug for College Statistics Help?
StudyPug is built for university students who need more than a textbook — students who want to understand the material, not just get through it. Here is what makes it different for College Statistics:
Diagnostic assessment first. Before you start working through content, a quick diagnostic identifies exactly which College Statistics topics need your attention. That means you are not wasting hours reviewing concepts you already know — you go straight to the gaps.
Certified-teacher video lessons that teach the method. Every College Statistics lesson on StudyPug is taught by an experienced, certified instructor — not generated by AI. The lessons walk you through each topic step-by-step, explaining the reasoning behind every step. The goal is genuine understanding: so you are prepared for the next course and the course after that, not just the upcoming midterm.
Adaptive practice that adjusts to you. StudyPug's practice system responds to how you are performing. Get a question right and the next one challenges you further. Struggle with a concept and the system brings you back to it with a different approach. This keeps your practice time focused and efficient.
Practice tests and mock exams for midterms and finals. Full practice tests built around the kind of questions that appear on real College Statistics assessments — based on real exam structures, not invented problems. You can work through them as many times as you need until the approach feels automatic.
Everything in one subscription. Your College Statistics subscription also gives you access to Calculus I–III, Linear Algebra, Differential Equations, and every other course on the platform. If you need to revisit a calculus concept that feeds into a statistics derivation, or get ahead in your next course, it is all there.
StudyPug offers free practice content you can start using today with no subscription required. When you are ready for full access, a 30-day money-back guarantee means there is no risk.
What You Learn in College Statistics: Key Topics at a Glance
Here is a summary of the major topic areas you will work through in a typical College Statistics course:
- Descriptive Statistics — measures of centre, spread, and shape; data visualisation including histograms and boxplots.
- Probability — fundamental probability rules, conditional probability, independence, Bayes' theorem.
- Probability Distributions — normal distribution and the Central Limit Theorem, binomial distribution, Poisson distribution.
- Estimation — point estimates, confidence intervals for means and proportions.
- Hypothesis Testing — one-sample and two-sample t-tests, z-tests, chi-square tests for independence and goodness-of-fit, ANOVA.
- Regression Analysis — simple linear regression, interpreting slope and intercept, R-squared, introduction to multiple regression.
- Non-parametric Methods — Mann-Whitney, Kruskal-Wallis (where included in the syllabus).
Each of these topic areas is covered in StudyPug with video lessons, worked examples, and practice problem sets. The O15 internal-link MAP contains no validated topic URLs for this page at this time, so direct topic links are omitted — browse the full College Statistics topic list from the course page.
How to Use StudyPug for College Statistics
Getting started is straightforward. When you arrive on StudyPug, the diagnostic assessment gives you a clear picture of where you stand across College Statistics topics. Use that to decide whether to follow the full course sequence from descriptive statistics through to regression, or to jump directly to the topic you need most right now.
For each topic, the recommended approach is: watch the certified-teacher video lesson first, then attempt the practice problems. When you get a question wrong, read the full step-by-step solution — not just the final answer — to understand where your reasoning went off track. The adaptive practice system will then bring that topic back at the right moment to reinforce it.
Before a midterm or final, use the practice tests in timed conditions. Work through the full test, mark it, then go back and watch the video lessons for any topic where you dropped marks. You can watch each lesson as many times as you need — there is no limit. Many students find that watching a lesson once for understanding and again the night before an exam is enough to feel fully prepared.
StudyPug works on desktop, tablet, and mobile — so you can fit a practice session into a study break, a commute, or a late-night cram before tomorrow's test. Start your free practice today and see exactly which College Statistics topics to focus on first.
College Statistics FAQ
Unsure how StudyPug works? Need help with setting up? Check our frequently asked questions or contact us for help.
What do you learn in College Statistics, and what topics does it cover?
College Statistics introduces the methods used to collect, analyse, and interpret data. Core topics include descriptive statistics, probability theory, probability distributions (normal, binomial, Poisson), sampling methods, confidence intervals, hypothesis testing, t-tests, ANOVA, correlation, and simple and multiple regression analysis. Many courses also cover chi-square tests and non-parametric methods. By the end, you can draw meaningful conclusions from data — a skill used across science, business, health, and social sciences.
What is the difference between College Statistics and a Probability & Statistics course?
College Statistics typically emphasises applied data analysis — interpreting results, running tests, and communicating findings. A Probability & Statistics course tends to give greater weight to the mathematical foundations of probability theory, including combinatorics, random variables, and probability proofs, before moving into inference. If you are in a business, health, or social science programme, College Statistics is usually the required course; maths and engineering programmes more often require the probability-heavy version.
What are the prerequisites for College Statistics, and what course comes after it?
Most College Statistics courses require at least Year 12 or NCEA Level 2 Mathematics, covering algebra and basic functions. Calculus is not always required but helps with understanding distributions. After College Statistics, students commonly continue to Applied Regression Analysis, Bayesian Statistics, Data Science fundamentals, or Econometrics — depending on their programme. A strong grasp of hypothesis testing and regression from College Statistics is the foundation for all of these.
Is College Statistics hard, and where do students struggle most?
College Statistics is manageable but catches many students off guard because it combines logical reasoning with calculation. The most common sticking points are understanding p-values and what 'statistical significance' actually means, setting up hypothesis tests correctly, choosing the right test for a given scenario, and interpreting regression output. Students who struggle often try to memorise formulas without understanding the underlying logic. Working through practice problems with step-by-step solutions — rather than just reading notes — makes a significant difference.
How is College Statistics assessed — and what should I expect in tests and finals?
In New Zealand university contexts, College Statistics is typically assessed through a mix of assignments or lab reports (often worth 30–40%), one or two tests (midterms), and a final examination. The final exam usually covers the full course and demands both calculation and written interpretation. Some courses include a statistical software component (R or Excel). Practising exam-style questions under timed conditions and reviewing past paper-style problems is the most effective preparation strategy.
What is one of the hardest topics in College Statistics, and how do you approach it?
Hypothesis testing is the topic most students find hardest — particularly understanding what a p-value means and how to draw the right conclusion. The key is to work through the five-step process consistently: state the hypotheses, choose the significance level, calculate the test statistic, find the p-value, and interpret in context. Many errors happen at the interpretation stage. Working through varied practice problems — t-tests, z-tests, chi-square, and ANOVA — builds the pattern recognition you need to select and apply the right test confidently on exams.





Written by the StudyPug Team
Last updated June 5, 2026
3 M+
students
★★★★★
4.8 average
K–12
all grades