Grade 12 AP Statistics Help — Video Lessons & Practice
Get clear explanations for any AP Statistics problem and build exam-ready confidence.


Certified-Teacher Concept Videos
Every AP Statistics lesson is taught step-by-step by a certified teacher — not AI — so you learn the method behind each problem and can tackle similar questions on the actual exam.
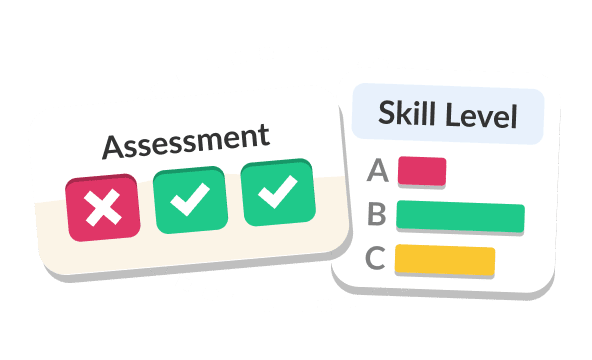
Diagnostic Assessment
A quick diagnostic pinpoints exactly which AP Statistics topics need work, so you focus your study time where it matters most and stop wasting time on topics you already know.

Adaptive Practice for AP Statistics
Practice problems adjust to your performance level, building from core probability to advanced inference so your AP Statistics skills grow steadily toward exam day.
Try It Now
Test your knowledge
Our approach aligns with the evidence
Exam Scores
Better Recall
Less Anxiety
AP Statistics Topics
1. Basic Concepts
2. Data Representation
3. Data Interpretation
4. Probability
5. Set Theory
6. Discrete Probabilities
7. Normal Distribution and Z-Scores
8. Confidence Intervals
9. Hypothesis Testing
9 Chapters · 50 Topics · 394 Videos
Discover Our Learning Areas
Explore key subjects and start learning with interactive content.


What is AP Statistics?
AP Statistics is a college-level course offered by the College Board that teaches students how to collect, analyse, and draw conclusions from data. Taken typically in Grade 12, it covers five major content areas — exploring data, sampling and experimentation, probability and random variables, statistical inference, and regression — and culminates in the AP Statistics exam each May. A strong score can earn college credit at universities across Ireland, the US, and beyond.
What topics are covered in AP Statistics?
The AP Statistics curriculum is broad but interconnected. Here is what you will work through across the year:
Exploring Data: Describing distributions of one and two variables using shape, centre, spread, and unusual features. You will work with dot plots, histograms, box plots, scatter plots, and residual plots.
Sampling and Experimentation: Planning and conducting studies, understanding random sampling methods, and recognising sources of bias. The difference between observational studies and controlled experiments is a key exam theme.
Probability and Random Variables: Basic probability rules, conditional probability, independence, discrete and continuous random variables, and the binomial and geometric distributions.
Sampling Distributions and the Central Limit Theorem: How sample means and proportions behave when many samples are drawn — the foundation for all inference procedures.
Statistical Inference: Constructing and interpreting confidence intervals and carrying out significance tests for means, proportions, differences between groups, and chi-square models. This is where most students invest the most study time.
Regression Analysis: Fitting and interpreting least-squares regression lines, checking conditions, transforming data to achieve linearity, and performing inference for regression slope.
Is AP Statistics hard?
AP Statistics is considered moderately difficult — more accessible than AP Calculus AB in terms of algebraic demand, but more conceptually nuanced than many students expect. The subject rewards careful reading and clear reasoning over rote calculation. The most common sticking points are writing technically correct interpretations of p-values and confidence intervals in context, understanding sampling distributions, and knowing which inference procedure to choose and why. Students who engage actively with practice problems — not just watching solutions — consistently improve their performance on free-response questions.
What comes before and after AP Statistics?
Most students are ready for AP Statistics after completing Algebra 2. Pre-Calculus is helpful but not required. AP Statistics can be taken alongside AP Calculus — the two courses cover independent content. After completing AP Statistics, students are exceptionally well-positioned for college courses in introductory statistics, data science, econometrics, business analytics, psychology research methods, and any STEM programme that involves quantitative reasoning. The AP exam score can substitute for a first-year college statistics requirement at many universities in Ireland, the UK, and North America.
How is AP Statistics graded and what is on the exam?
The College Board AP Statistics exam is three hours long and divided into two sections. Section I is 40 multiple-choice questions worth 50% of the total score; students have 90 minutes. Section II is free-response: five shorter questions plus one extended investigative task, also worth 50%, completed in 90 minutes. Free-response answers must include clear statistical reasoning and correct contextual interpretation — partial credit is awarded, so showing your thinking matters. Scores range from 1 to 5; a score of 3 or above is accepted for college credit at most universities.
Why StudyPug for AP Statistics?
StudyPug is built specifically for students who need to understand the method, not just memorise steps. Every AP Statistics lesson is recorded by a certified teacher — not generated by AI — and walks through the reasoning behind each procedure so you can apply it to new problems you have never seen before. That distinction matters enormously on AP free-response questions, where the College Board rewards statistical thinking, not template answers.
When you join StudyPug, a diagnostic assessment identifies the specific AP Statistics topics where you are losing marks — whether that is probability rules, inference procedures, or interpreting regression output. Instead of working through every lesson from the beginning, you focus where it counts. As you practise, the adaptive system adjusts problem difficulty to keep you in the productive zone: challenging enough to build skill, manageable enough to build confidence.
AP Statistics exam prep is included in your StudyPug subscription. Practice problems are based on real AP exam-style question formats, covering both multiple-choice reasoning and the kind of extended written response the free-response section demands. You can access every lesson and practice set on any device, any time — useful when exam season arrives and you need to review sampling distributions at 11 pm the night before a test.
StudyPug also offers free practice content — sample problems and topic previews you can try without a subscription. If you decide to subscribe and are not satisfied within the first 30 days, you are covered by a full money-back guarantee. There are no long-term contracts, and you can cancel at any time.
What you learn in AP Statistics — curriculum coverage
StudyPug's AP Statistics content covers every unit tested on the AP exam, structured to match the College Board course framework. Lessons progress from data exploration through probability to inference, mirroring the order most teachers follow across the academic year. Key topics include:
- Describing and comparing distributions (shape, centre, spread)
- Scatter plots, correlation, and least-squares regression
- Designing studies: sampling methods and experimental design
- Basic probability, conditional probability, and independence
- Discrete and continuous random variables; binomial and geometric models
- Sampling distributions of means and proportions; Central Limit Theorem
- Confidence intervals for one and two proportions, one and two means
- Significance tests: z-tests, t-tests, chi-square tests, and inference for regression
- Communicating statistical results in written context
Because no validated internal topic links are available for this page in the current sitemap, the full list of individual topic lessons is accessible by browsing the AP Statistics course page directly.
How to use StudyPug to prepare for AP Statistics
The most effective workflow for AP Statistics students on StudyPug is a three-step loop: diagnose, watch, and practise.
Step 1 — Diagnose. Take the diagnostic assessment as soon as you sign up. It takes around 15–20 minutes and produces a personalised topic map showing where your understanding is solid and where there are gaps. This is your study plan.
Step 2 — Watch. Go to each flagged topic and watch the certified-teacher video lesson. Pause when you need to think. The lessons teach the method — why each step is taken — not just how to execute it. For inference topics in particular, pay attention to the conditions check and the written interpretation, since these are where marks are most commonly lost on the AP exam.
Step 3 — Practise. After watching, attempt the practice problems for that topic. The adaptive system will track your performance and adjust difficulty. When you can solve unfamiliar variations of a problem type with confidence, move to the next topic on your diagnostic map.
As the AP exam approaches, shift to mixed practice sets that combine multiple topic areas — this mirrors the multi-step reasoning the AP free-response questions demand. Use the exam-style questions to practise writing full statistical conclusions in context, including the four-part structure (hypotheses, conditions, test statistic and p-value, conclusion) that AP graders reward.
StudyPug is available 24/7, so you can fit study sessions around your school timetable. Whether you are reinforcing a concept the evening after class or doing a focused revision session on inference the week before the exam, every lesson and practice set is there when you need it.
AP Statistics FAQ
Unsure how StudyPug works? Need help with setting up? Check our frequently asked questions or contact us for help.
What do you learn in AP Statistics, and what topics does it cover?
AP Statistics covers five major areas: exploring data (describing patterns in distributions), sampling and experimentation (how data is collected), probability and random variables (modelling chance), statistical inference (confidence intervals and significance tests), and regression analysis (linear and non-linear models). You learn to interpret data critically, design studies, and draw conclusions supported by evidence — skills that apply well beyond the classroom and directly to the AP exam.
What is the difference between AP Statistics and AP Calculus?
AP Statistics focuses on collecting, analysing, and interpreting data using probability and inference. It is algebra-based and centres on real-world decision-making under uncertainty. AP Calculus, by contrast, studies continuous change through derivatives and integrals. Statistics is less formula-heavy but demands careful reasoning; Calculus is more procedural and equation-driven. Many students find Statistics more intuitive at first but are surprised by the depth of conceptual thinking required for inference topics like hypothesis testing.
Is AP Statistics hard, and where do students struggle most?
AP Statistics is considered moderately challenging. The mathematics is not as algebraically demanding as Calculus, but students frequently struggle with the language of inference — writing correct interpretations of p-values, confidence intervals, and Type I/II errors in context. Probability rules and sampling distributions also trip up many learners. The key is understanding the reasoning behind each procedure, not just memorising formulas, which is exactly the approach the step-by-step video lessons on StudyPug take.
What should I take before AP Statistics, and what comes after it?
Most students take AP Statistics after completing Algebra 2 or Pre-Calculus; a strong foundation in algebra and basic probability helps enormously. It can be taken alongside or after AP Calculus — the two courses are independent. After AP Statistics, students are well-prepared for college-level introductory statistics, data science courses, econometrics, psychology research methods, or any STEM programme that involves data analysis. The AP score (3, 4, or 5) can earn college credit at many universities.
Is AP Statistics on the AP exam, and how is it tested?
Yes. The College Board AP Statistics exam is a three-hour assessment taken in May. It consists of a multiple-choice section (40 questions, 50% of the score) and a free-response section (five short-answer questions plus one investigative task, 50% of the score). Free-response questions require written statistical reasoning and context-specific interpretation. Scores run from 1 to 5; most universities award credit for a score of 3 or above. StudyPug's practice is based on real AP exam-style questions to help you prepare.
What is one of the hardest concepts in AP Statistics and how do you tackle it?
Sampling distributions of the sample mean and sample proportion are consistently the most challenging AP Statistics topic. Students struggle to distinguish the distribution of the population, the distribution of a single sample, and the distribution of many sample statistics. The key is to work through many concrete examples: start with a simple population, manually generate several samples, calculate each sample mean, then observe the pattern that emerges. StudyPug's video lessons walk through this process step by step, connecting the Central Limit Theorem to real exam problems.

