College Statistics Help: Video Lessons & Practice
Work through every topic with clear solutions. Start your free practice test now!


Step-by-Step Statistics Video Lessons
Certified-teacher videos break down probability, distributions, and hypothesis testing so you understand the method — not just the answer — and stay ready for the next course.

Diagnostic Assessment + Adaptive Practice
A quick diagnostic pinpoints exactly what to focus on. Then adaptive practice adjusts difficulty to your performance so every session builds real statistics skills.

Full Exam Prep: Midterms & Finals
Practice with statistics mock exams and topic-by-topic review covering every testable concept. Watch lessons unlimited times until it clicks before exam day.
Try It Now
Test your knowledge
Our approach aligns with the evidence
Exam Scores
Better Recall
Less Anxiety
College Statistics Topics
1. Basic Concepts
2. Data Representation
3. Data Interpretation
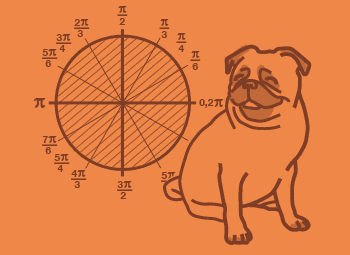
4. Probability
5. Set Theory
6. Discrete Probabilities
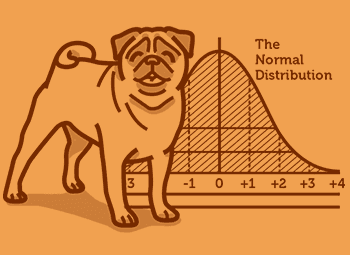
7. Normal Distribution and Z-Scores
8. Confidence Intervals
9. Hypothesis Testing
9 Chapters · 54 Topics · 423 Videos
Discover Our Learning Areas
Explore key subjects and start learning with interactive content.


What Is College Statistics?
College Statistics is the introductory university-level course that teaches you how to collect, summarize, analyze, and interpret data using mathematical methods. It builds the quantitative reasoning skills that every science, social science, business, and health-profession program depends on. If you are looking for reliable College Statistics help, this course is the foundation — and getting it right sets you up for every data-driven course that follows.
What Are the Main Topics You Study in College Statistics?
College Statistics is organized into two broad halves: descriptive statistics and inferential statistics.
Descriptive statistics covers summarizing data sets with measures of center (mean, median, mode), measures of spread (variance, standard deviation, interquartile range), and visual representations such as histograms, boxplots, and scatterplots. These tools let you describe what a data set looks like before drawing any conclusions.
Inferential statistics is where most students need the most College Statistics help. You learn probability theory — including conditional probability, Bayes' theorem, and the rules for independent and dependent events — before moving into probability distributions (binomial, normal, t, chi-square, and F distributions). From there the course builds to confidence intervals and hypothesis testing, which together form the engine of scientific reasoning. You finish with correlation, simple linear regression, and often an introduction to ANOVA and chi-square tests for categorical data.
Knowing the full arc of the course helps you practice with purpose and connect each topic to what comes next.
How Hard Is College Statistics, and What Trips Students Up Most?
Most students find College Statistics more conceptually demanding than they expected. The arithmetic is not especially advanced, but the logical structure of hypothesis testing — stating hypotheses, verifying assumptions, computing a test statistic, finding a p-value, and writing a conclusion in plain language — requires careful, layered thinking under exam pressure.
The three areas where students consistently lose the most points are:
1. Probability: Conditional probability and Bayes' theorem require you to track which event you are conditioning on. Small notation errors compound into large wrong answers.
2. Choosing the right test: Knowing whether to run a one-sample t-test, a two-sample t-test, a paired t-test, or an ANOVA is a decision that requires understanding assumptions — sample size, independence, normality — not just formulas.
3. Interpreting results: A p-value below 0.05 does not prove the null hypothesis is false; it tells you the data would be unlikely if it were true. Professors test this distinction directly. Students who understand the reasoning rather than memorizing a rule perform measurably better on free-response sections.
Consistent College Statistics practice — working through problems, checking solutions, and understanding where reasoning went wrong — is the most reliable path to exam readiness.
How Is College Statistics Graded at US Universities?
A standard College Statistics course at a US university grades students across several components. Two to three midterm exams typically account for 40–50% of the final grade combined. A comprehensive final exam — often covering all major inferential topics — carries 30–40% weight. Weekly homework or online problem sets (frequently administered through platforms such as MyStatLab or ALEKS) contribute the remainder, sometimes alongside a short data analysis project.
Professors weight free-response problems heavily because they require you to show full reasoning, not just a numeric answer. This is why step-by-step College Statistics solutions — not just answer keys — are essential preparation. Understanding every line of a worked solution is how you replicate that reasoning independently under exam conditions.
What Comes After College Statistics?
The course you take after College Statistics depends on your major. Common follow-on courses include:
Applied Regression Analysis — extends the linear regression introduced in intro stats to multiple predictors, model diagnostics, and prediction.
Probability Theory — a more rigorous, calculus-based treatment of the probability foundations underlying all statistical inference.
Biostatistics — applies statistical methods specifically to biological and health-science research, including survival analysis and clinical trial design.
Econometrics — regression and inference applied to economic data, with emphasis on causality and panel data.
Whatever path you take, the concepts you are learning now — distributions, confidence intervals, hypothesis testing — appear in every one of these courses. Building a genuine understanding of the method in College Statistics, not just a procedural memory, is the investment that pays off in every subsequent quantitative class.
Why StudyPug for College Statistics Help?
StudyPug is built specifically to support university-level courses with the kind of depth and flexibility students at this level need.
Diagnostic assessment: Before you spend hours reviewing material, StudyPug's diagnostic pinpoints exactly which College Statistics topics are costing you points. You get a focused study plan immediately — no guessing, no wasted sessions on topics you already understand.
Certified-teacher concept videos: Every lesson is taught by an experienced, certified instructor — not generated by AI. The videos teach the method and the reasoning behind it, so you understand why a confidence interval is constructed the way it is, not just how to compute one. That depth of understanding is what separates students who do well on novel exam questions from those who only recognize familiar problem types.
Adaptive practice: After watching a lesson, adaptive practice adjusts the difficulty of College Statistics practice problems to match your current level. It pushes you forward when you are ready and returns to foundational steps when you need reinforcement. Every session is productive.
Full course coverage in one subscription: One StudyPug subscription covers College Statistics alongside Calculus I–III, Linear Algebra, Differential Equations, and every other university math course. If your curriculum touches multiple subjects, you are covered without paying extra.
Exam prep for midterms and finals: Mock exams and practice tests are organized by exam type so you can simulate real College Statistics test conditions, identify weak areas, and review targeted video lessons before your actual exam. You can watch solutions unlimited times until the approach is completely clear.
30-day money-back guarantee: StudyPug backs every subscription with a 30-day money-back guarantee. If you are not satisfied within the first 30 days, you receive a full refund — no questions asked.
What You Learn: College Statistics Course Coverage
StudyPug's College Statistics content covers the full scope of a standard introductory university statistics course. Topics include:
- Descriptive statistics: mean, median, mode, variance, standard deviation, IQR
- Data visualization: histograms, boxplots, stem-and-leaf plots, scatterplots
- Probability rules: addition rule, multiplication rule, conditional probability, Bayes' theorem
- Discrete distributions: binomial, geometric, Poisson
- Continuous distributions: uniform, normal, standard normal (Z), t-distribution
- Sampling distributions and the Central Limit Theorem
- Confidence intervals for means and proportions (one-sample and two-sample)
- Hypothesis testing: one-sample and two-sample t-tests, paired t-tests, Z-tests for proportions
- Chi-square tests for goodness of fit and independence
- ANOVA (one-way)
- Correlation and simple linear regression, including residual analysis
Because no validated internal topic URLs are currently available for the College Statistics course page, all topic navigation is handled through the on-page topic browser and the course module links.
How to Use StudyPug for College Statistics
The most effective approach combines all three core features in a consistent weekly routine.
Start with the diagnostic. Run the diagnostic assessment at the beginning of the semester, not the week before finals. Knowing which areas need work early gives you time to address them before they affect your midterm grades.
Watch the concept video first. For each new College Statistics topic, watch the certified-teacher lesson before attempting practice problems. Understanding the reasoning — the why — makes the practice problems dramatically more useful because you are building a mental model, not just pattern-matching to a formula.
Practice adaptively. After the video, move into adaptive practice. Work through problems at increasing difficulty. When you hit a concept that still feels uncertain, go back to the video — you can watch it as many times as needed.
Use mock exams strategically. Two to three weeks before each midterm or final, switch to mock exam mode. Simulate timed exam conditions, then review the step-by-step solutions for every question you missed. This is the closest simulation of actual exam performance you can get outside the exam room.
Free daily practice as a warm-up. StudyPug's free daily practice content lets you keep your College Statistics skills sharp on low-effort days — a few problems before class, a quick quiz between study sessions. Consistent low-stakes practice keeps retention high without demanding long study blocks every day.
Getting better at College Statistics is a process of steady, focused effort. StudyPug gives you the tools to make that effort efficient and exam-ready from day one.
College Statistics FAQ
Unsure how StudyPug works? Need help with setting up? Check our frequently asked questions or contact us for help.
What do you learn in College Statistics, and what topics does it cover?
College Statistics covers the core tools for collecting, analyzing, and interpreting data. You will study descriptive statistics (mean, median, standard deviation), probability theory, discrete and continuous distributions, confidence intervals, hypothesis testing, correlation, and linear regression. Many courses also introduce ANOVA and chi-square tests. By the end you can design a basic study, analyze results, and draw statistically valid conclusions — skills used in virtually every quantitative field.
What is the difference between College Statistics and AP Statistics?
AP Statistics is a standardized high school course aimed at earning college credit through the AP exam. College Statistics is the actual university-level course and typically goes deeper into inferential methods, probability distributions, and regression. Credit earned via AP may let you skip the intro college course. If you are in College Statistics proper, you are working at a higher level of rigor with more emphasis on mathematical derivations and applied problem sets.
What are the prerequisites for College Statistics, and what course comes after it?
Most programs require College Algebra or Precalculus before enrolling in College Statistics. Some science and business tracks accept it without calculus. After completing College Statistics, students commonly take Applied Regression Analysis, Probability Theory, Biostatistics, or Econometrics depending on their major. Data Science and Psychology majors often follow with courses in experimental design or multivariate analysis. Knowing your pathway helps you understand which concepts to solidify now.
Is College Statistics hard, and where do students struggle most?
College Statistics challenges most students not because the math is advanced but because the concepts require careful logical reasoning. The most common struggle points are probability rules (especially conditional probability and Bayes' theorem), selecting the correct hypothesis test for a given scenario, and interpreting p-values correctly. Students who invest time in understanding the reasoning behind each procedure — not just memorizing formulas — consistently outperform those who try to plug and chug without understanding why.
How is College Statistics assessed — midterms, finals, and assignments?
A typical College Statistics course at a US university is graded with two to three midterm exams, a comprehensive final, weekly homework or online problem sets, and sometimes a data analysis project. The final exam often accounts for 30–40% of the total grade. Many professors use multiple-choice sections combined with free-response problems that require you to show all work and interpret your output. Consistent practice and mock-exam familiarity are the most reliable ways to prepare.
What is one of the hardest topics in College Statistics, and how do you approach it?
Hypothesis testing is widely considered the most conceptually difficult topic. Students must simultaneously manage the null and alternative hypotheses, choose the right test statistic, understand Type I and Type II errors, and interpret a p-value in context — all under exam time pressure. The best approach is to work through structured examples step by step: state hypotheses, verify assumptions, compute the test statistic, find the p-value, and write a conclusion in plain language. Repetition with varied scenarios builds the instinct needed for exam success.

