Statistics Help: Video Lessons & Practice
Step-by-step video lessons, adaptive practice, and mock exams — everything you need to get better at Statistics.

Certified-Teacher Video Lessons
Learn the method, not just the answer. Step-by-step Statistics lessons taught by experienced instructors — so you're ready for the next course, not just this exam.

Diagnostic Assessment + Adaptive Practice
A quick diagnostic pinpoints exactly what to focus on. Then adaptive practice adjusts to your performance, so every session builds real Statistics skills.

Statistics Exam Prep — Midterms & Finals
Practice tests and mock exams that mirror real midterms and finals. Watch solutions as many times as you need until every concept clicks.
Try It Now
Test your knowledge
Our approach aligns with the evidence
Exam Scores
Better Recall
Less Anxiety
Statistics Topics
1. Basic Concepts
2. Data Representation
3. Data Interpretation
4. Discrete Probabilities
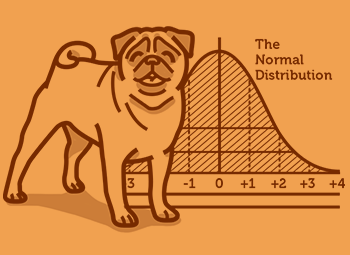
5. Normal Distribution and Z-score
6. Confidence Intervals
7. Combinatorics
8. Probability
9. Set Theory
10. Hypothesis Testing
10 Chapters · 62 Topics · 516 Videos
Discover Our Learning Areas
Explore key subjects and start learning with interactive content.


What is University Statistics?
University Statistics is the study of how to collect, organize, analyze, and interpret numerical data to make informed decisions under uncertainty. At its core, Statistics teaches you to move beyond raw numbers and draw valid conclusions — whether you're analyzing survey results, running a clinical trial, or forecasting business trends. It is a required or strongly recommended course in programs ranging from psychology and economics to engineering, public health, and data science.
The discipline divides broadly into two branches: descriptive statistics (summarizing and visualizing data) and inferential statistics (using sample data to draw conclusions about a larger population). University-level courses cover both, with increasing emphasis on inference as you progress.
What topics are covered in university Statistics?
A standard introductory university Statistics course covers descriptive statistics, probability rules, discrete distributions (binomial, geometric, Poisson), continuous distributions (normal, t, chi-square, F), sampling distributions, confidence intervals, and hypothesis testing. One- and two-sample tests, ANOVA, and linear regression typically round out the course.
More advanced Statistics courses — Regression Analysis, Mathematical Statistics, Time Series, Bayesian Statistics — build on this foundation. Business Statistics emphasizes decision-making applications; Biostatistics adds study-design methodology relevant to health research. Regardless of your program, the core inference framework you learn in introductory Statistics reappears throughout every advanced course, so getting it right early pays dividends across your degree.
Why do students find Statistics difficult?
Statistics is routinely described by students as harder than expected — not because the calculations are complex, but because the concepts require a genuine shift in how you think about evidence and uncertainty. The biggest reported difficulty is hypothesis testing: understanding what a p-value actually means, why failing to reject the null does not prove it is true, and how to choose the right test for a given scenario.
Probability distributions are another common stumbling block. Many students can calculate a probability once they know which distribution to use, but choosing between a binomial and a Poisson, or knowing when to apply a t-distribution rather than a z, requires conceptual understanding rather than formula recall. Regression interpretation — reading a coefficient, understanding standard error, recognizing violations of assumptions — is a third area where students who relied on memorization tend to struggle at the end of semester.
The evidence consistently points to the same solution: practice problems, worked through step by step, with the reasoning explained alongside the mechanics. Reading notes builds familiarity; working problems builds understanding.
How is university Statistics assessed in the US?
US university Statistics courses are almost universally assessed through a combination of graded homework or problem sets (typically weekly), one or two midterm exams, and a cumulative final exam. Some courses add a lab or computing component using R, Python, SPSS, or Excel, and upper-division courses may include a data analysis project. Midterms generally focus on probability and distributions; finals are comprehensive and heavily weight inference — hypothesis testing and regression.
For students earlier in their academic journey, the AP Statistics exam (scored 1–5) can earn college credit and is structured around the same core topics. The GRE quantitative section tests statistical reasoning for graduate applicants. Preparing with practice tests based on real exam formats is the most efficient way to build the speed and accuracy both formats reward.
Why use StudyPug for university Statistics?
StudyPug is built around three things that matter most for Statistics success: knowing exactly what to work on, understanding the reasoning behind every procedure, and getting enough practice to make that reasoning automatic.
The platform opens with a diagnostic assessment that maps your current understanding across all Statistics topics — hypothesis testing, probability, regression, distributions — and identifies precisely where your gaps are. Instead of reviewing everything from week one, you focus on the specific concepts that will move your grade.
Every topic is covered by certified-teacher video lessons that teach the method, not just the answer. That distinction matters in Statistics more than almost any other course: a video that shows you the steps to a hypothesis test but never explains the logic behind the null hypothesis will leave you stuck the moment the exam asks a question from a different angle. StudyPug's instructors are not AI-generated — they are experienced educators who build each lesson around genuine conceptual understanding, so you are prepared for the next course, not just the next exam.
After each lesson, adaptive practice adjusts its difficulty based on your performance, reinforcing topics where you are shaky and advancing you once you have demonstrated understanding. You are not grinding through problems you have already solved, and you are not skipping over problems you still need.
For exam preparation, StudyPug provides practice tests and mock exams built around the content of midterms and finals. You can watch solution videos as many times as needed until the approach is solid. The platform covers Statistics, Calculus I–III, Linear Algebra, Differential Equations, and every other university course — all in one subscription, with no per-course fees.
What you learn in university Statistics — course coverage
StudyPug's Statistics content covers the full scope of a standard university course and beyond. Core topics include:
- Descriptive Statistics: measures of center and spread, frequency distributions, data visualization
- Probability: rules of probability, conditional probability, Bayes' theorem, independence
- Probability Distributions: binomial, geometric, Poisson, uniform, normal, exponential
- Sampling Distributions: the central limit theorem, sampling distribution of the mean and proportion
- Confidence Intervals: one- and two-sample intervals for means and proportions
- Hypothesis Testing: one- and two-sample z- and t-tests, chi-square tests, ANOVA
- Regression Analysis: simple and multiple linear regression, correlation, model diagnostics
- Non-parametric Methods: rank-based tests for when distribution assumptions do not hold
Because no validated internal topic URLs are available for this page at the time of publication, topic links will be added as the sitemap is updated. Check the Statistics course page on StudyPug for the full, current topic list.
How to use StudyPug to improve your Statistics grade
The most effective workflow on StudyPug follows a straightforward loop: diagnose, watch, practice, test.
Start with the diagnostic. It takes a few minutes and gives you a prioritized list of topics to address. Students who skip the diagnostic and start at topic one typically spend time on material they already understand — the diagnostic eliminates that inefficiency.
Watch the lesson for each flagged topic. Pause when you need to, rewind when a step is unclear, and take notes on the reasoning — not just the formula. The goal is to be able to explain why the procedure works, not just execute it.
Work the adaptive practice problems. After watching, close your notes and attempt the problems. When you get one wrong, use the step-by-step solution to identify exactly where your reasoning diverged — not just what the right answer was.
Use mock exams to simulate real conditions. Two weeks before midterms or finals, shift to timed practice tests. This builds the pacing and pressure tolerance that homework sets alone do not develop.
StudyPug is available on any device, so you can keep this loop going whether you're at a desk before class or reviewing on your phone between sessions. Free practice content is available without a subscription; a 30-day money-back guarantee covers full access if you decide to go all-in before your next exam.
Statistics FAQ
Unsure how StudyPug works? Need help with setting up? Check our frequently asked questions or contact us for help.
What do you learn in university Statistics, and what topics does it cover?
University Statistics covers the core methods used to collect, analyze, and interpret data. You'll study descriptive statistics, probability theory, discrete and continuous distributions, sampling methods, confidence intervals, hypothesis testing, and regression analysis. More advanced courses add ANOVA, chi-square tests, non-parametric methods, and time series. The goal is to move from understanding raw data to drawing valid, evidence-based conclusions — a skill applied across business, health sciences, social sciences, and engineering.
What is the difference between Statistics and Biostatistics?
Statistics is a general discipline covering probability, inference, and data analysis across all fields. Biostatistics applies those same core methods specifically to biological and health sciences data — clinical trials, epidemiology, public health research, and survival analysis. The mathematical foundations are largely the same, but Biostatistics introduces specialized techniques like Kaplan-Meier curves, logistic regression for health outcomes, and study-design considerations unique to medical research. If you're in a life-sciences or health program, Biostatistics is typically your required stats course.
What are the prerequisites for university Statistics, and what course comes after it?
Most introductory Statistics courses require only basic algebra or pre-calculus. Calculus-based Statistics (often called Mathematical Statistics or Probability & Statistics) requires single-variable calculus. After introductory Statistics, students typically progress to Regression Analysis, Probability Theory, Statistical Computing (R or Python), or Experimental Design. In quantitative programs, it's common to continue into Econometrics, Machine Learning, or Advanced Biostatistics. Building a solid foundation now makes every subsequent data-heavy course significantly easier.
Is university Statistics hard, and where do students struggle most?
Statistics has a reputation for being harder than students expect — not because the algebra is advanced, but because the concepts require a shift in thinking. The biggest struggle points are hypothesis testing (understanding p-values and what 'reject the null' actually means), probability distributions (knowing when to apply which one), and interpreting regression output. Students who treat statistics as memorizing formulas tend to fall behind; those who focus on understanding the logic of inference tend to do well. Consistent practice problems are the most reliable path to closing those gaps.
How is university Statistics assessed — midterms, finals, and assignments?
Most university Statistics courses are assessed through a combination of weekly problem sets or homework, one or two midterm exams, and a comprehensive final. Midterms typically cover foundational topics like probability and distributions; finals are cumulative and often include hypothesis testing and regression. Some courses include a data analysis project or lab component using software like R or SPSS. In the US, Statistics is also a topic on the AP Statistics exam at the high school level and appears on the GRE quantitative section for graduate school applicants.
What is one of the hardest topics in Statistics, and how do you approach it?
Hypothesis testing is consistently the hardest topic for students because it combines abstract logic with formal procedure. The key is to separate two things: the conceptual question (what am I actually testing?) and the mechanical steps (setting up H₀ and H₁, choosing a test, calculating the test statistic, interpreting the p-value). Work through the logic on a simple example before moving to formulas. Practice is essential — doing ten varied hypothesis tests, checking your reasoning against step-by-step solutions, builds the intuition that a single reading of notes cannot.

