TOPIC
Climate Change, Evidence and impactsMY PROGRESS
Pug Score
0%
Getting Started
"Let's build your foundation!"
Best Streak
0 in a row
Study Points
+0
Overview
Practice
Read
Quiz
Next Steps
Get Started
Get unlimited access to all videos, practice problems, and study tools.
BACK TO MENU
Topic Progress
Pug Score
0%
Getting Started
"Let's build your foundation!"
Best Practice
No score
Read
Not viewed
Best Quiz
No attempts
Best Streak
0 in a row
Study Points
+0
Overview
Practice
Read
Quiz
Next Steps
Read
Climate Change: Exploring the Evidence and Understanding the Impacts
This topic examines the scientific evidence for climate change and explores its measurable impacts on Earth's atmosphere, oceans, ecosystems, and human societies.
Understanding Climate Change: Evidence and Impacts
Climate change refers to long-term shifts in global temperatures and weather patterns. While natural factors have always influenced climate, scientific evidence overwhelmingly shows that human activities particularly the burning of fossil fuels have become the dominant driver of rapid warming since the Industrial Revolution. Students exploring this topic build on foundational knowledge from Carbon Cycle and Carbon Movement and Climate Effects and Solar Influence.
The greenhouse effect is the natural process by which atmospheric gases absorb infrared radiation from Earth's surface and re-emit it, warming the lower atmosphere. Human activities have intensified this process, causing global average temperatures to rise approximately 1.1°C above pre-industrial levels.
Scientific Evidence for Climate Change
Scientists rely on multiple independent lines of evidence to document and confirm climate change. These include direct instrumental records and indirect climate proxies that extend the historical record far beyond human observation.
Direct Temperature Records
Systematic temperature measurements from thousands of weather stations and ocean buoys since the mid-1800s provide the most direct evidence of rising global average temperatures. These datasets show a clear, consistent warming trend confirmed by satellite data.
The Keeling Curve
Recorded continuously at Mauna Loa Observatory since 1958, the Keeling Curve documents the ongoing rise in atmospheric CO concentration from approximately 315 ppm in 1958 to over 420 ppm today. This is one of the most important datasets in climate science.
Ice Cores and Climate Proxies
Ice cores drilled from glaciers contain trapped air bubbles that preserve ancient atmospheric samples, allowing scientists to measure past concentrations of greenhouse gases going back 800,000 years. Current CO levels far exceed any concentration recorded in that entire period. Other climate proxies indirect records such as tree rings, coral bands, and pollen deposits allow scientists to reconstruct temperature and precipitation patterns before instrumental records existed. Wider tree rings typically indicate warmer, wetter growing seasons, while narrower rings reflect cooler or drier conditions.
Carbon Isotope Fingerprinting
Fossil fuels carry a distinct isotopic signature depleted in carbon-13 and carbon-14. As these fuels are burned, the proportion of these isotopes in atmospheric CO decreases a chemical fingerprint that directly links rising CO to fossil fuel combustion rather than natural sources.
Arctic Sea Ice Decline
Satellite data show a consistent, decades-long decline in Arctic sea ice extent and thickness, reflecting the phenomenon of Arctic amplification where polar regions warm two to three times faster than the global average. This connects directly to concepts explored in Solar Radiation and Energy from Space and Energy Distribution and Global Patterns.
Impacts of Climate Change
Sea Level Rise
Global sea levels have risen approximately 20 centimeters since 1900 due to two main causes: the melting of glaciers and ice sheets adding meltwater to the oceans, and the thermal expansion of seawater as it warms. Low-lying coastal communities and small island nations face the greatest immediate threat from rising seas, including saltwater intrusion into freshwater wetlands and aquifers.
Ocean Acidification
Oceans have absorbed roughly 2530% of all human CO emissions since the Industrial Revolution. When CO dissolves in seawater, it reacts with water to form carbonic acid (HCO), lowering ocean pH a process called ocean acidification. Average surface ocean pH has dropped from 8.2 to 8.1, representing a 26% increase in hydrogen ion concentration because the pH scale is logarithmic (base 10). This threatens marine organisms such as corals and shellfish that depend on calcium carbonate to build their shells.
Coral Bleaching
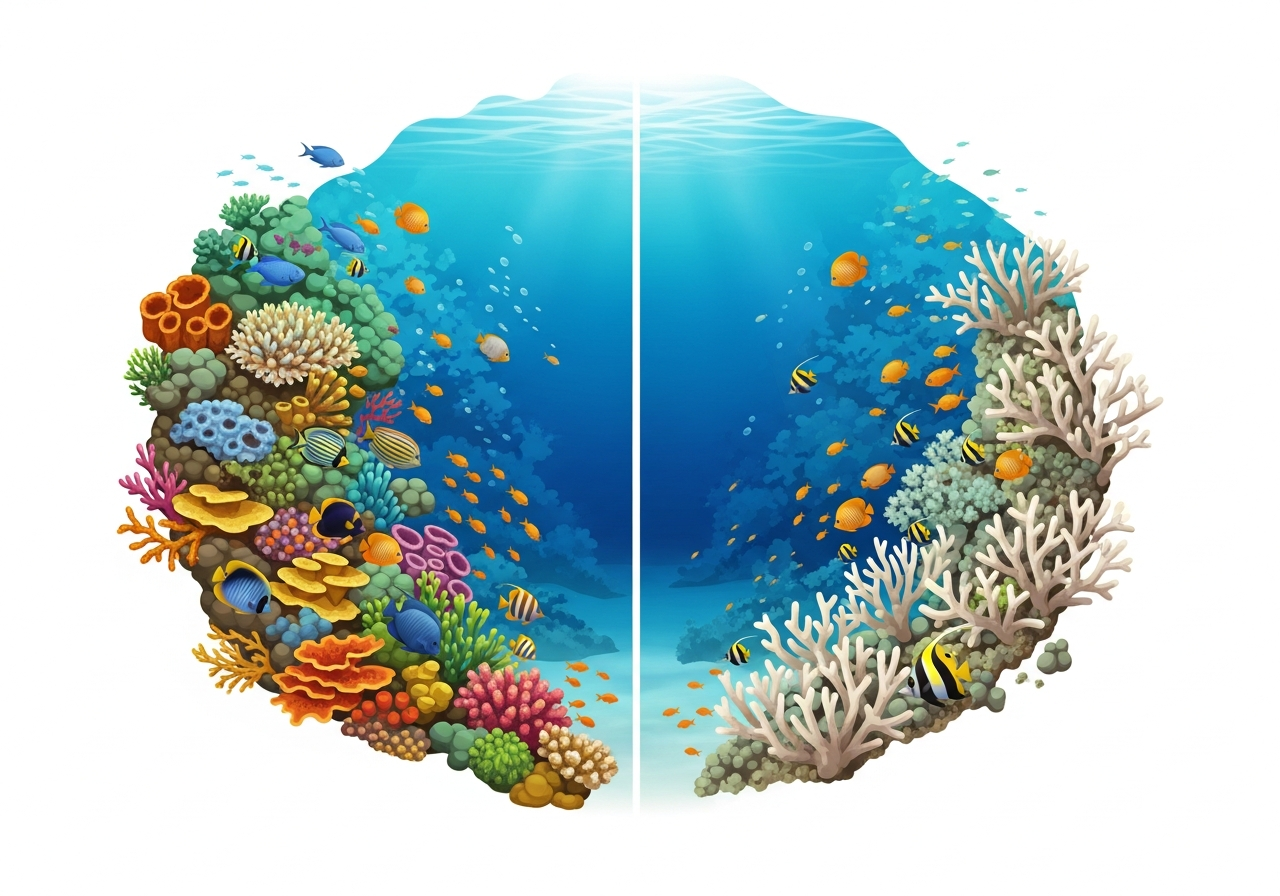
Coral bleaching occurs when elevated ocean temperatures cause corals to expel the symbiotic algae (zooxanthellae) living in their tissues. Without these algae, corals turn white and become vulnerable to disease and death. Bleaching events have become more frequent and severe as ocean temperatures rise.
Ecosystem and Biological Impacts
Rising temperatures are causing measurable shifts in biological timing a field called phenology. Earlier spring blooms, shifted migration patterns, and earlier planting seasons are all documented evidence of climate change's ecological impact. Many species are migrating toward the poles or to higher altitudes as their habitats warm, disrupting food webs and ecosystems. These changes connect to topics explored in Biodiversity and Species Relationships and Environmental Impact and Human Influences.
Thermohaline Circulation
Thermohaline circulation often called the "global conveyor belt" moves heat between ocean basins and regulates regional climates. Climate change threatens to disrupt this circulation, potentially causing dramatic shifts in regional weather patterns across the globe.
Human Health Impacts
As temperatures rise, disease-carrying mosquitoes that transmit malaria and dengue fever are expanding into regions previously too cold for their survival. Climate change also worsens air quality and increases the frequency of heat-related illnesses.
Feedback Loops and Tipping Points
A positive feedback loop amplifies the original change in the climate system. A key example is the ice-albedo feedback: when Arctic sea ice melts, it exposes darker ocean water that absorbs far more solar energy than reflective ice, causing further warming and more melting. Another critical feedback involves permafrost permanently frozen subsurface ground in Arctic regions. As permafrost thaws due to rising temperatures, it releases stored methane and CO, powerful greenhouse gases that accelerate further warming.
A tipping point is a critical threshold in the climate system where a small change triggers a larger, self-reinforcing shift that becomes difficult or impossible to reverse. Examples include the potential collapse of the West Antarctic Ice Sheet or the dieback of the Amazon rainforest. These concepts build on system dynamics explored in Energy Flow and System Dynamics and Matter Connections and System Interactions.
Climate sensitivity is the key metric scientists use to project long-term warming specifically, how much global temperature would rise if atmospheric CO doubled. Higher climate sensitivity means greater projected warming.
Key Terms & Definitions
Greenhouse Effect: The natural (and human-enhanced) warming mechanism in which atmospheric gases such as CO, methane, and water vapor absorb infrared radiation from Earth's surface and re-emit it, trapping heat in the lower atmosphere and warming Earth's surface.
Radiative Forcing: A measure of how strongly a factor such as increased CO or changes in solar output alters Earth's energy balance. Positive radiative forcing values indicate a warming influence on the climate system.
Carbon Footprint: A measure of the total greenhouse gas emissions expressed in CO-equivalent units produced directly or indirectly by an individual, organization, product, or activity.
Permafrost: Permanently frozen subsurface ground found primarily in Arctic and subarctic regions. When permafrost thaws due to rising temperatures, it decomposes and releases stored CO and methane into the atmosphere, amplifying climate change through a positive feedback loop.
Climate Proxies: Indirect records such as ice cores, tree rings, coral bands, and pollen deposits that scientists use to reconstruct past temperature, precipitation, and atmospheric composition before instrumental records existed.
Coral Bleaching: A stress response in corals triggered by elevated ocean temperatures, causing them to expel their symbiotic zooxanthellae algae. This leaves corals white and vulnerable, threatening reef ecosystems worldwide.
Thermohaline Circulation: The global system of ocean currents driven by differences in water temperature and salinity, often called the "global conveyor belt." It distributes heat between ocean basins and regulates regional climates; its disruption could drastically alter weather patterns.
Climate Sensitivity: The projected increase in global average temperature resulting from a doubling of atmospheric CO concentration. It is a key metric used by scientists to estimate the magnitude of long-term warming.
Phenology: The scientific study of cyclic and seasonal natural phenomena, particularly in relation to climate and plant and animal life such as the timing of spring blooms, bird migrations, and insect emergence. Shifts in phenology serve as observable biological evidence of climate change.
Tipping Point: A critical threshold in the climate system beyond which feedback loops drive the system into a new, often irreversible state. Examples include the collapse of the West Antarctic Ice Sheet or the large-scale dieback of the Amazon rainforest.
Ocean Acidification: The process by which oceans become more acidic as they absorb excess atmospheric CO, which reacts with seawater to form carbonic acid, lowering ocean pH and threatening marine organisms that rely on calcium carbonate.
Positive Feedback Loop: A process in which an initial change triggers responses that amplify the original change. In climate science, the ice-albedo feedback and permafrost thaw are key examples that accelerate warming.
Keeling Curve: A continuous record of atmospheric CO concentrations measured at Mauna Loa Observatory, Hawaii, since 1958. It shows a consistent upward trend from about 315 ppm to over 420 ppm and is one of the most important datasets in climate science.
Global Warming: The long-term increase in Earth's average surface temperature, primarily driven by the buildup of greenhouse gases from human activities. It is a global trend measured over decades, distinct from short-term local weather events.
Applying Climate Change Concepts
Students can strengthen their understanding by analyzing real datasets such as the Keeling Curve to observe the continuous rise in atmospheric CO, or by examining ice core data to compare past and present greenhouse gas concentrations. Learners can also investigate how the logarithmic nature of the pH scale explains why a 0.1-unit drop in ocean pH represents a 26% increase in hydrogen ion concentration a key analytical skill for understanding ocean acidification.
Connecting these concepts to Solutions and Sustainable Practices and Green Technology and Environmental Solutions helps students evaluate both the scale of the problem and the range of human responses available. Learners can also explore how the Human Impact on Environmental Change topic frames the role of deforestation, agriculture, and fossil fuel combustion in driving current climate trends.
Prerequisite Knowledge & Related Topics
A solid understanding of this topic requires familiarity with several foundational concepts. The Carbon Cycle and Carbon Movement explains how carbon moves between the atmosphere, oceans, land, and living organisms essential for understanding how human emissions disrupt natural balances. Water Cycle and Global Water Distribution and Nitrogen Cycle and Nutrient Cycling provide context for how climate change disrupts interconnected Earth systems, as explored in Cycle Disruption and Environmental Effects.
Understanding Solar Radiation and Energy from Space and Energy Distribution and Global Patterns is critical for grasping how Earth's energy balance is altered by greenhouse gases. Students should also draw on knowledge from Energy Flow and System Dynamics and Matter Connections and System Interactions to understand feedback mechanisms.
Related Topics & Connections
This topic connects directly to several important areas of study. Climate Factors, Global Patterns, and Earth System provides the broader framework for understanding what drives climate variability, while this topic focuses specifically on human-driven change and its measurable consequences.
Environmental Impact and Human Influences extends the analysis of how human activities from deforestation to industrial agriculture alter Earth's systems beyond just the atmosphere. System Dynamics and Complex Interactions deepens understanding of how feedback loops and tipping points operate within interconnected Earth systems.
The ecological consequences of climate change are further explored in Biodiversity and Species Relationships, where students examine how shifting habitats and phenological changes affect species survival and ecosystem stability. Resource Use and Management Strategies and Conservation and Protection Methods build on this topic by examining how societies can manage natural resources and protect ecosystems in the face of climate change. Finally, Earth System, Resource Management, and Sustainable Practices integrates all these themes into a comprehensive view of humanity's relationship with the planet.