Statistics Help Made Clear
Expert guidance for probability, distributions, and data analysis
📈
Exam scores improve 10-15%
✨
Complex concept mastery
💡
Statistical method application
📚
Higher assignment completion

Step-by-Step Video Lessons
Master hypothesis testing, regression, and analysis methods

Complete Practice System
Practice with datasets, calculations, and interpretations

Guaranteed Results
Most students improve one letter grade in 4-6 weeks
Statistics Topics
Help
1. Graphing Data
2. Designing Studies
3. Measures of Central Tendency
4. Measures of Dispersion
5. Discrete Probabilities
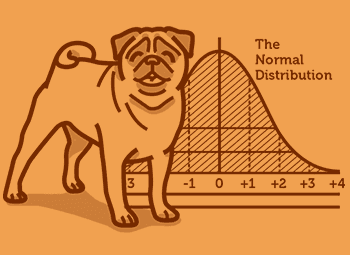
6. Normal Distribution and Z-Scores
7. Confidence Intervals
8. Bivariate Data
9. Permutations and Combinations
10. Probability
11. Hypothesis Testing
11Chapters
82Topics
677Videos


What is statistics?
Statistics – a word so pervasive and colloquially thrown around in the real world some question "Is statistics math?" Well, we hate to break it to you, but according to Wikipedia, Statistics is defined as the "a branch of mathematics dealing with the collection, analysis, interpretation, presentation, and organization of data". While certainly a specialized branch of math, statistics does fall under the discipline of math. In academia, students are most likely to encounter the study of probability and statistics in conjunction with one another. Probability is generally defined as the likelihood something will occur. You have probably heard these terms used interchangeably such as in a seemingly witty sentence beginning with "Statistically speaking the chances of … are …". In math, we assign probability a value between 0 to 1 (i.e. 0% to 100%), where 0 represents impossibility while the value of 1 represents absolute certainty.
What some may find even more surprising is how the study of probability and statistics is actually very interdisciplinary in nature. Most commonly, probability and statistics for engineering and sciences are hot topics in tertiary education that spans the likes of kinesiology, psychology, sociology, life sciences, medicine, and the many types of engineering. Nowadays, stats courses are even catered specifically for the program of study, such as business statistics or statistics for psychology or nursing.
In statistics, the broad objective is data analysis, to achieve the desired outcome of a statistic(s). Typically this may involve the use of an ANOVA, chi-square test, linear regression, and so forth. To analyse data, this requires knowledge of statistics math and probability math. Now armed with the statistic(s) result(s), data can now be interpreted. Unlike most other branches of math however, this final step often involves less math and more writing (good news at last?!). In this day and age, tertiary education has also begun merging the study of statistics with computer science where data is now processed and analysed through computer programming languages/software.
Is statistics hard?
Like most things in life, statistics is hard – but not impossible! Here at StudyPug, we offer all the stats help you require. We understand that some of you already feel stuck even though you are just beginning with basic statistics or perhaps you want to learn statistics but feel defeated or demotivated already – we get it. Do not stop there, while you feel tempted to look up all the AP stats book answers, zone out, or give up trying, know that that does not solve anything. Try us out now for free and let us help you overcome hard stats questions in no time!
Trust us to take you through introduction to statistics, or statistics for data science, or introduction to probability, and take us with you wherever you go! Learn stats online with our comprehensive statistics classes and improve your knowledge and skills at solving statistic problems. Exercise statistics daily with our library of questions, never struggle with stats homework again and be liberated from your fear of math! Together with the help of StudyPug, let's change your mindset of math and see actual results of improvement and success! Remember, every advancement made in improving your understanding or learning new stats skills is progress, and with progress find yourself tackling hard statistic questions with ease!
How to learn statistics?
Tired of asking google for "a kumon near me"? StudyPug can help you with all your statistical needs from the convenience of your home, café, school, and even on the go! With multiple online statistics courses, 24/7 help, and several free intro lessons, here at StudyPug we support learning for all levels and curricula beginning at stats for dummies all the way up to university stats! So whether you are looking for a specific data course or hoping to improve your understanding with some additional statistics review, you have come to the right place.
Learning statistics? Find all the help you need with Statistics right away in one place! Browse through all of the statistics topics we cover and easily find the topic you need help with right away! Just getting started? We have organized our topics and lessons in order of difficulty starting with core concepts and building in succession to more advanced concepts and questions. With 1000's of lessons accompanied by step-by-step examples, we have made easy practice to enhance your learning and to drill in your understanding of all things statistics! Take the stress out of math and let us provide you with all the statistics homework help you need right now with our statistic tutorials. Learn alongside our statistics videos, discover study tips, learn new skills, and apply your understanding by testing yourself with the best practice questions on statistics you can find!
How to pass statistics?
There is no substitute for hard work
To succeed in passing statistics is no small feat. Although at StudyPug we strive to teach you in ways that feels like statistics is made easy, we do not shy away from the fact that passing is going to take a lot of hard work and effort! These are not two mutually exclusive events! Moreover if you plan on doing well at statistics, this is going to be a greater challenge, even though we have made stats for dummies! Learning statistics online has never been easier so start your statistics exam prep today! Our team of well experienced educators have crafted the perfect stats study guide for you and know how to prepare students for all the permutations and combinations of questions you will face in exams, tests, and quizzes!
Whether you are looking for help with elementary statistics, high school statistics, statistics 101, or even for college stats our recipe is for you: begin with working on the topics you find the toughest - Do not panic, our stats tutors will be here for you every step of the way. So whether you are struggling with understanding the different types of distributions in statistics, frequency histograms, hypothesis testing, confidence intervals, or cannot figure out how to read statistic charts, we'll be able to fix that in no time!
While this may seem daunting, we encourage students to do this, as these topics will take the greatest amount of time to revise, so you will also want to start early, get ahead of the game and reduce your stress even more! Our short and sweet video lessons will give you the crash course statistics information you need within minutes! Then, follow your statistics tutor lead you through some key statistics examples of statistical math problems you will likely encounter in your assessments. Once you have surveyed the different types of questions you will likely expect in your upcoming exam, take a shot at your inventory of practice questions. We want you to be confident fully prepared to tackle all kinds of questions, especially the ones that easily trip students up! With over 100's of unique practice questions, never run of practice again! If you are ever feeling stuck again, quickly slip back to one of our example video lessons and learn the steps to solving similar kinds of statistic problems. With our 24/7, instant access, help with statistics, and enough practice, go from always feeling like you are stuck in elementary statistics to a mathematical statistics wiz! Together, let's ace that stats test, improve your understanding, and excel in stats together!