Overview
Watch
Read
Next Steps
Read
How to Read and Interpret Venn Diagrams: A Comprehensive Guide
Venn diagrams are powerful visual tools for representing relationships between sets. Key points include understanding overlapping regions, exclusive areas, and the universal set. These diagrams are crucial in various fields, from mathematics and logic to business and science. They help simplify complex information, making it easier to analyze and draw conclusions. The importance of Venn diagrams in academic and practical applications cannot be overstated. They enhance critical thinking, problem-solving skills, and data interpretation with Venn diagrams. To truly grasp Venn diagrams, regular practice is essential. Create your own diagrams, interpret existing ones, and apply them to real-world scenarios. This hands-on approach will solidify your understanding and improve your analytical skills. Remember, the introduction video serves as an excellent foundation for mastering Venn diagrams. By combining the video's insights with consistent practice, you'll develop a valuable skill set applicable across numerous disciplines. Embrace Venn diagrams as a versatile tool for organizing and visualizing information effectively.
Example:
Reading Information from Venn Diagrams
In a playground 6 students like to play on the swings and 12 students like to play on the jungle gym. 4 students played on both.
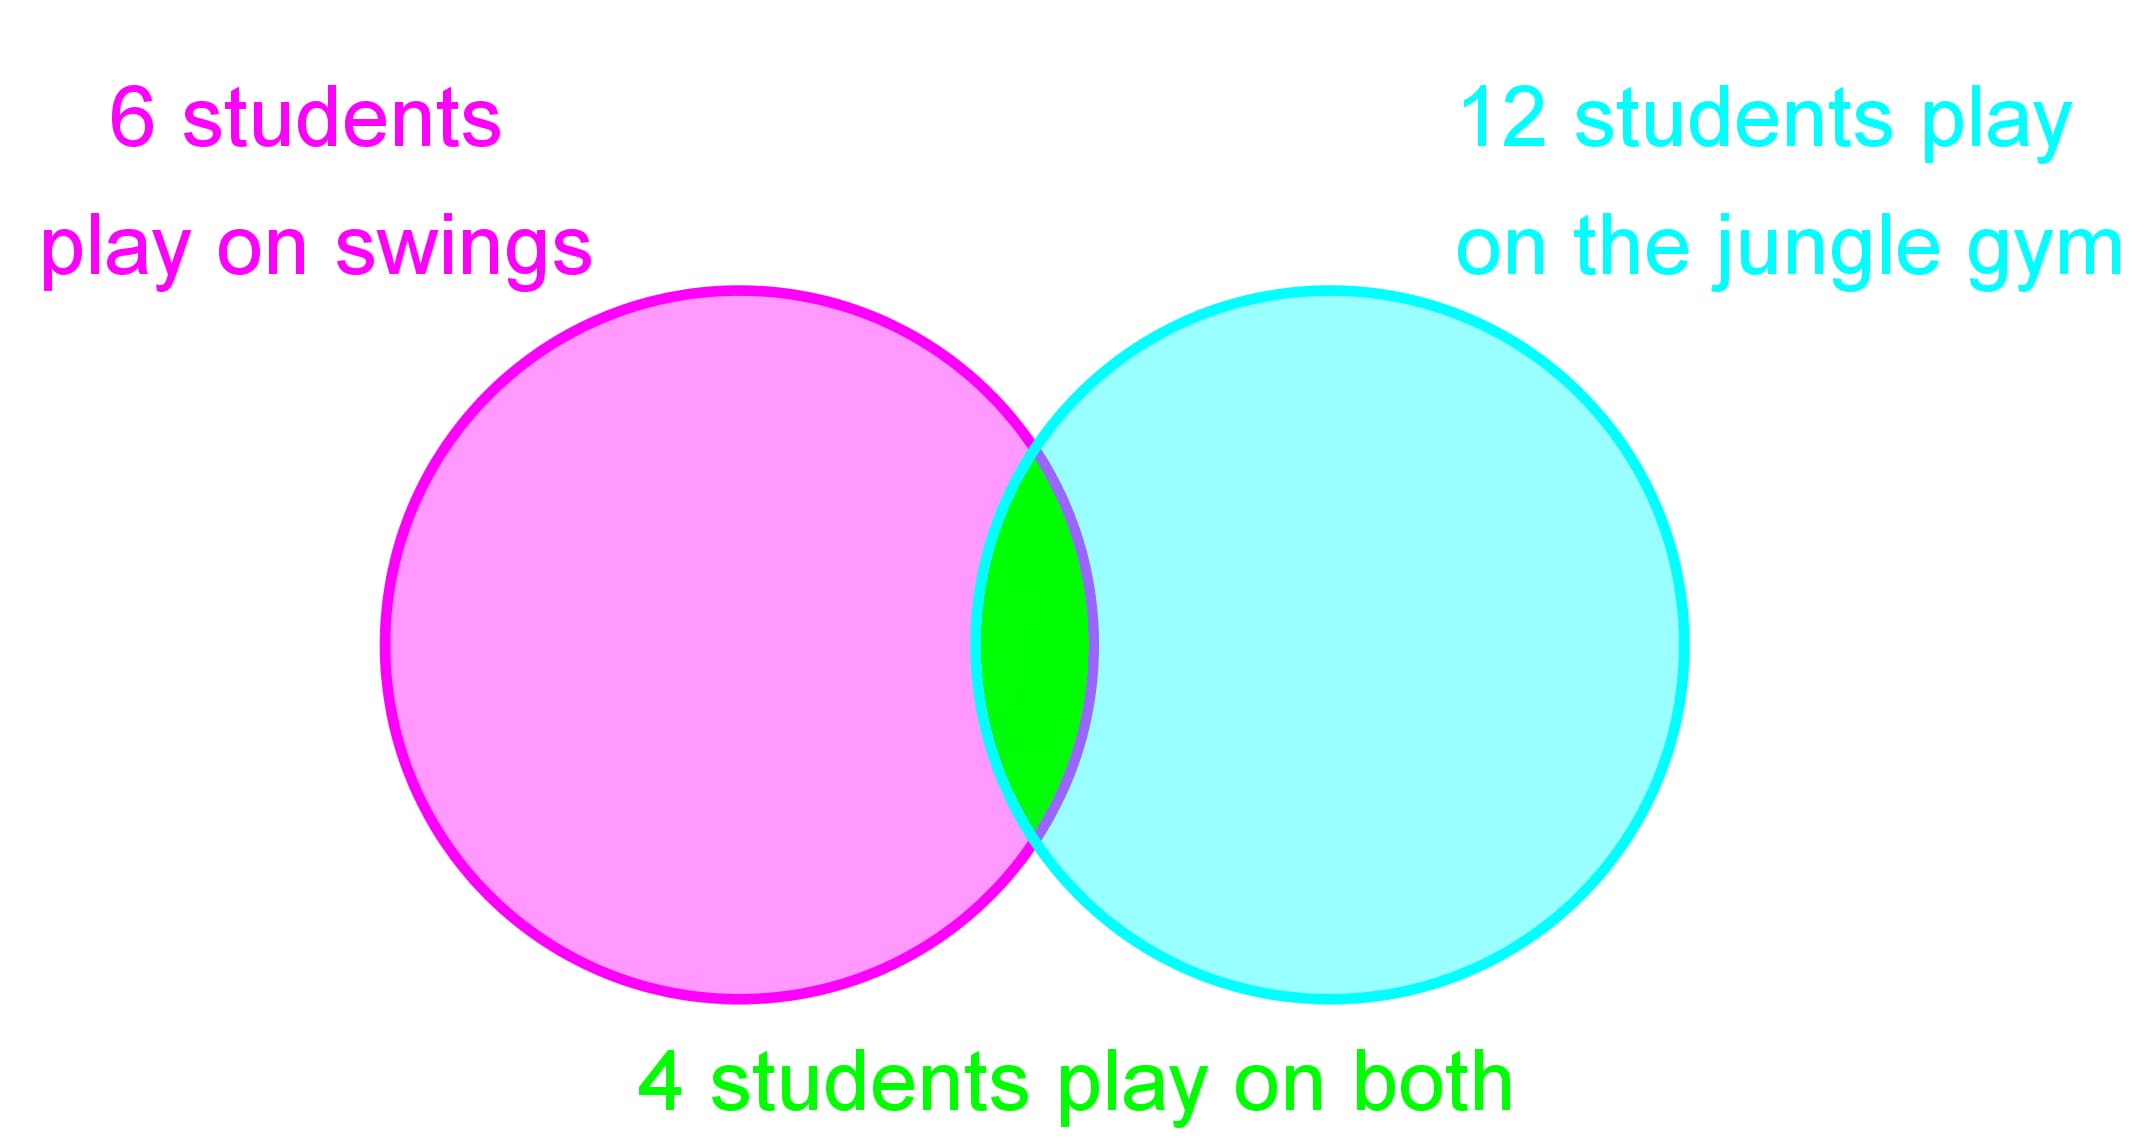
How many students play only on the swings?
Step 1: Understand the Problem
First, we need to understand the problem and the information given. We know that there are 6 students who like to play on the swings, 12 students who like to play on the jungle gym, and 4 students who play on both. The question asks us to find out how many students play only on the swings.
Step 2: Identify the Total Number of Students in Each Category
We need to identify the total number of students in each category. The total number of students who play on the swings is 6, and the total number of students who play on the jungle gym is 12. However, 4 students play on both the swings and the jungle gym. This overlap is crucial for solving the problem.
Step 3: Visualize the Venn Diagram
Visualizing the Venn diagram can help us understand the distribution of students. In the Venn diagram, one circle represents students who play on the swings, and the other circle represents students who play on the jungle gym. The overlapping area represents students who play on both.
Step 4: Calculate the Number of Students Playing Only on the Swings
To find the number of students who play only on the swings, we need to subtract the number of students who play on both from the total number of students who play on the swings. This can be calculated as follows:
Number of students playing only on the swings = Total students on swings - Students playing on both
Using the given numbers:
Number of students playing only on the swings = 6 - 4
Step 5: Verify the Calculation
It's important to verify our calculation to ensure accuracy. We calculated that 2 students play only on the swings. To verify, we can add the number of students playing only on the swings and the number of students playing on both:
Total students on swings = Students playing only on swings + Students playing on both
Using the calculated numbers:
6 = 2 + 4
This confirms that our calculation is correct.
Step 6: Conclusion
In conclusion, by understanding the problem, identifying the total number of students in each category, visualizing the Venn diagram, calculating the number of students playing only on the swings, and verifying our calculation, we can determine that 2 students play only on the swings.
FAQs
Here are some frequently asked questions about Venn diagrams:
1. What Is a Venn Diagram?
A Venn diagram is a visual representation of the relationships between different sets of data. It uses overlapping circles or other shapes to show how elements in different sets are related, including commonalities and differences.
2. How do you interpret a Venn diagram?
To interpret a Venn diagram, start by identifying the sets represented by each circle. Look at the overlapping areas to see elements shared between sets. Non-overlapping areas represent elements unique to each set. The area outside all circles but within the rectangle (if present) represents elements not in any set.
3. What does and mean in math?
In set theory and Venn diagrams, represents intersection (elements common to two or more sets), while represents union (all elements in either set). For example, A B means elements in both A and B, while A B means elements in A or B or both.
4. How do you read a Venn diagram notation?
Venn diagram notation uses symbols to represent set operations. For example, A' means the complement of A (elements not in A), A B represents the intersection of A and B, and A B represents their union. Numbers in each region indicate the count of elements in that specific area.
5. How to read a Venn diagram with two circles?
In a two-circle Venn diagram, each circle represents a set. The overlapping area shows elements common to both sets. Areas outside the overlap but within a circle contain elements unique to that set. The region outside both circles (if within a rectangle) represents elements not in either set.
Prerequisite Topics
Understanding the foundation of any subject is crucial for mastering more complex concepts. When it comes to reading and drawing Venn diagrams, two key prerequisite topics play a vital role in building a solid understanding. These topics are the relationship between two variables and probability with Venn diagrams.
The concept of relationships between sets is fundamental to grasping Venn diagrams. By understanding how variables interact and relate to each other, students can better interpret the information presented in these visual representations. The relationship between two variables forms the basis for creating and analyzing Venn diagrams, as these diagrams essentially illustrate the connections and overlaps between different sets or groups.
When students have a strong grasp of how variables relate, they can more easily identify patterns and relationships within Venn diagrams. This knowledge allows them to quickly recognize intersections, unions, and complements of sets, which are core components of Venn diagram analysis. Moreover, understanding these relationships helps in interpreting real-world scenarios represented by Venn diagrams, making the concept more applicable and relevant.
Another crucial prerequisite topic is probability with Venn diagrams. This concept bridges the gap between basic set theory and more advanced applications of Venn diagrams in statistics and data analysis. By understanding how probability relates to the areas within a Venn diagram, students can solve complex problems involving overlapping events or characteristics.
The ability to calculate probabilities using Venn diagrams is an essential skill that builds upon the foundation of creating Venn diagrams. It allows students to quantify the likelihood of events occurring within different sets or combinations of sets. This knowledge is particularly valuable in fields such as data science, market research, and risk assessment, where understanding the probability of various outcomes is crucial.
By mastering these prerequisite topics, students will find themselves well-equipped to tackle more advanced concepts in reading and drawing Venn diagrams. They will be able to create accurate representations of complex relationships, interpret intricate diagrams with ease, and apply their knowledge to solve real-world problems. The skills gained from studying the relationship between two variables and probability with Venn diagrams serve as building blocks for a deeper understanding of set theory, logic, and statistical analysis.
In conclusion, investing time in thoroughly understanding these prerequisite topics will pay dividends as students progress in their study of Venn diagrams. It will not only make the learning process smoother but also enhance their ability to apply this knowledge in various academic and professional contexts. By recognizing the importance of these foundational concepts, students can build a strong framework for success in mathematics, statistics, and related fields.