Overview
Watch
Read
Next Steps
Read
Mastering Probability with Venn Diagrams
In this article, we've explored the powerful tool of Venn diagrams for probability calculations. We've covered how to represent sets, intersections, and unions visually, making complex probability problems more manageable. Understanding Venn diagrams is crucial for solving a wide range of probability scenarios, from simple two-set problems to more complex three-set situations. We encourage you to practice using Venn diagrams regularly, applying them to various probability questions you encounter. This will help solidify your understanding and improve your problem-solving skills. Remember, the introduction video provided at the beginning of this article serves as an excellent resource for further clarification and examples. By mastering Venn diagrams, you'll gain a valuable skill that extends beyond probability, applicable in fields like statistics, data analysis, and logical reasoning. Keep practicing, and you'll soon find yourself confidently tackling even the most challenging probability problems with ease.
Example:
Venn Diagrams Represent Events
Out of a school of 100 students the number of students enrolled in PE and Band class is given below:
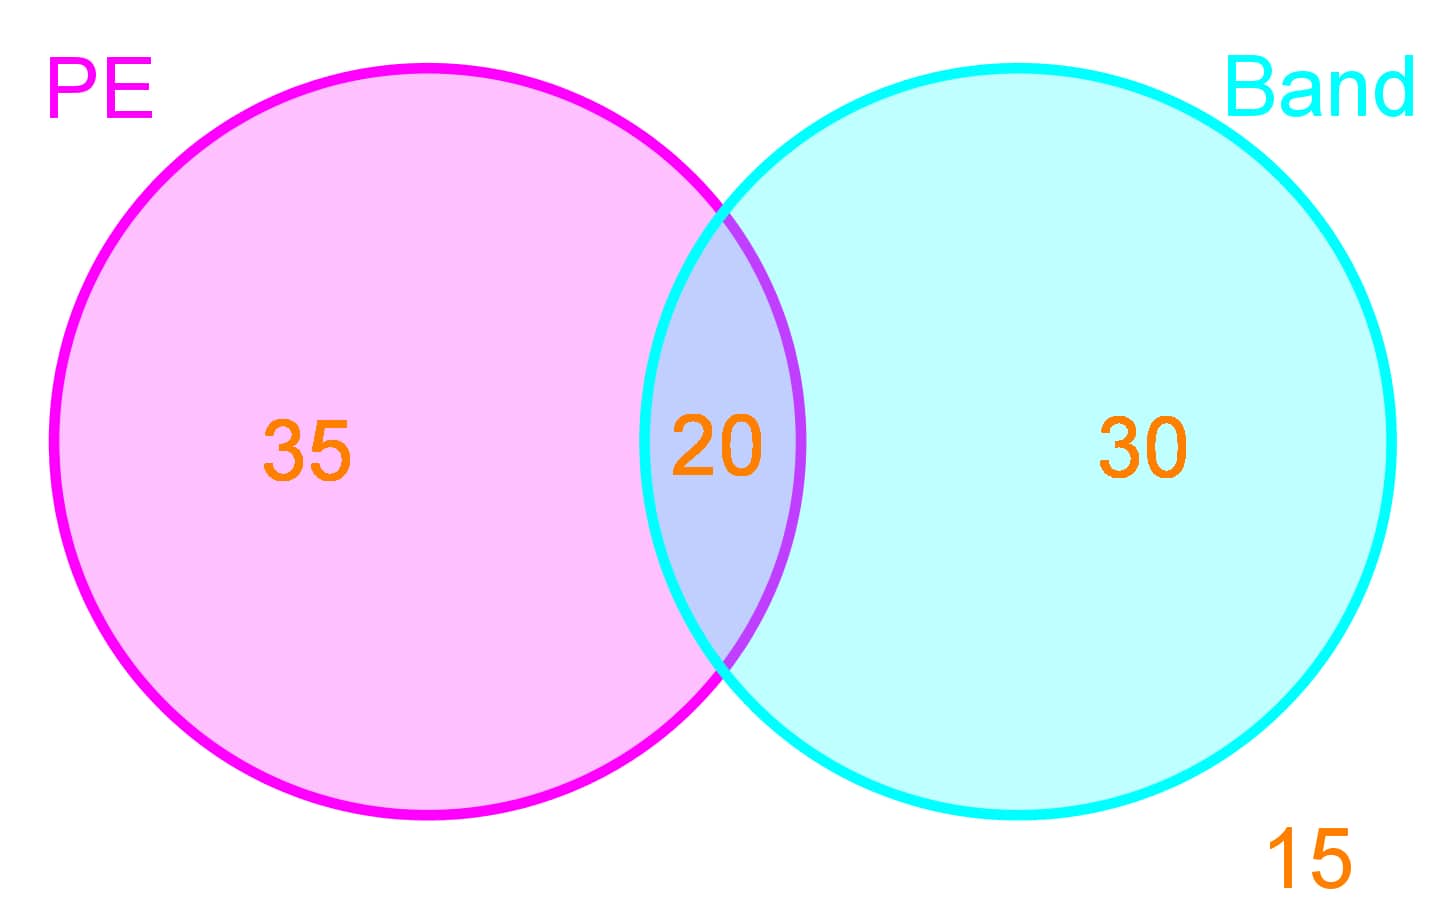
So there are 35 students who are taking only PE classes, 30 students who are taking only Band classes, and 20 students who are taking both PE and Band classes. There are also 15 students who are not enrolled in PE or Band classes.
Replicate this Venn diagram in terms of probabilities of picking a random student from any of these classes.
Step 1: Understanding the Sample Space
The first step in solving this problem is to understand the sample space. The sample space is the total number of students, which is 100. This means that any probability we calculate will be out of these 100 students. The sample space is represented by the entire area of the Venn diagram.
Step 2: Identifying the Events
Next, we need to identify the events. In this case, the events are:
- Students taking only PE classes
- Students taking only Band classes
- Students taking both PE and Band classes
- Students not taking either PE or Band classes
Step 3: Calculating Individual Probabilities
To convert the numbers into probabilities, we divide each number by the total number of students (100). Here are the calculations:
- Probability of taking only PE classes: 35/100 = 0.35
- Probability of taking only Band classes: 30/100 = 0.30
- Probability of taking both PE and Band classes: 20/100 = 0.20
- Probability of not taking either PE or Band classes: 15/100 = 0.15
Step 4: Drawing the Venn Diagram with Probabilities
Now, we can draw the Venn diagram and label each section with the calculated probabilities. The Venn diagram will have two overlapping circles, one for PE and one for Band. The overlapping section represents students taking both classes. Outside the circles, we have the probability of students not taking either class.
Step 5: Verifying the Total Probability
Finally, we need to verify that the total probability sums to 1. Adding up all the probabilities:
- 0.35 (only PE) + 0.30 (only Band) + 0.20 (both PE and Band) + 0.15 (neither) = 1.00
FAQs
Here are some frequently asked questions about probability with Venn diagrams:
1. How do you find the probability in a Venn diagram?
To find the probability in a Venn diagram, divide the number of elements in the desired region by the total number of elements in the sample space. For example, if you want to find the probability of event A, count the number of elements in circle A and divide by the total number of elements in the diagram.
2. What is a diagram used to calculate probabilities?
Venn diagrams are commonly used to calculate probabilities. They visually represent sets and their relationships, making it easier to understand and compute probabilities for various events and their combinations.
3. How do you calculate P(A B)?
P(A B) represents the probability of both events A and B occurring. In a Venn diagram, this is the overlapping region of circles A and B. To calculate it, count the number of elements in the overlap and divide by the total number of elements in the sample space.
4. How do Venn diagrams help you to understand probability?
Venn diagrams provide a visual representation of sets and their relationships, making it easier to understand concepts like unions, intersections, and complements. They help in visualizing the sample space and how different events relate to each other, which is crucial for calculating probabilities accurately.
5. How to solve conditional probability in a Venn diagram?
To solve conditional probability using a Venn diagram, focus on the region representing the given condition as the new sample space. For P(A|B), look at the overlap of A and B, then divide it by the total area of B. This visual approach helps in understanding and calculating conditional probabilities more intuitively.
Prerequisite Topics for Probability with Venn Diagrams
Understanding probability with Venn diagrams is a crucial skill in statistics and mathematics. However, to fully grasp this concept, it's essential to have a solid foundation in several prerequisite topics. These fundamental concepts not only provide the necessary background but also enhance your ability to interpret and apply Venn diagrams in probability scenarios.
First and foremost, a strong understanding of basic probability rules is vital. This foundational knowledge helps you comprehend how probabilities are calculated and interpreted within Venn diagrams. Knowing the fundamental principles of probability sets the stage for more complex applications in Venn diagram representations.
Another critical prerequisite is the intersection of sets. This concept is directly applicable to Venn diagrams, as these visual tools often represent overlapping sets. Understanding how sets intersect and unite is crucial for interpreting the shared regions in Venn diagrams and calculating probabilities based on these intersections.
The probability of independent events is another key concept that ties into Venn diagrams. While Venn diagrams often show related events, understanding independence helps in distinguishing between overlapping and non-overlapping regions, which is essential for accurate probability calculations.
Moreover, the addition rule of probability is particularly relevant when working with Venn diagrams. This rule is often applied when calculating probabilities involving multiple events or sets, which is a common scenario in Venn diagram problems. Understanding this rule helps in correctly summing probabilities across different regions of the diagram.
Lastly, conditional probability is a concept that frequently comes into play when dealing with Venn diagrams. It involves calculating the probability of an event given that another event has occurred, which is often visually represented in Venn diagrams through overlapping regions.
By mastering these prerequisite topics, you'll be well-equipped to tackle probability problems using Venn diagrams. These foundational concepts provide the necessary tools to interpret the visual information presented in Venn diagrams, perform accurate calculations, and draw meaningful conclusions from probability scenarios. Remember, a strong grasp of these prerequisites not only aids in understanding Venn diagrams but also enhances your overall proficiency in probability and statistics.