Grade 12 AP Statistics Help — Video Lessons & Practice
Get clear explanations for any AP Statistics problem and build exam-ready confidence.

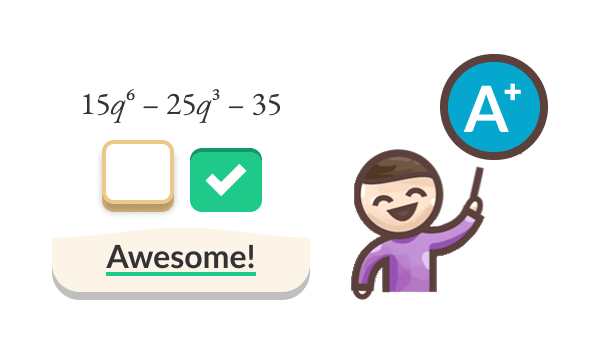
Step-by-Step Video Lessons
Watch solutions to solve problems yourself.
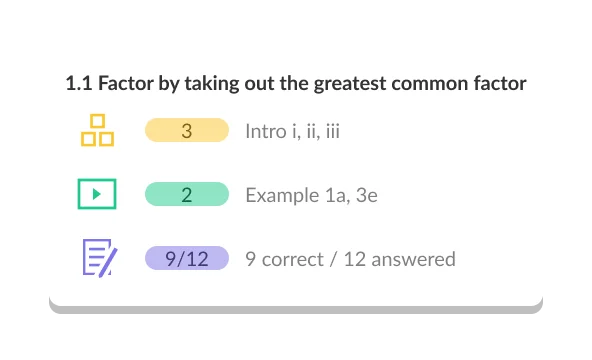
Build Mastery
Master each topic before the next test.

Real Exam Practice
Practice real AP exam questions in your plan.
Try It Now
Test your knowledge
Our approach aligns with the evidence
Exam Scores
Better Recall
Less Anxiety
AP Statistics Topics
1. Basic Concepts
2. Data Representation
3. Data Interpretation
4. Probability
5. Set Theory
6. Discrete Probabilities
7. Normal Distribution and Z-Scores
8. Confidence Intervals
9. Hypothesis Testing
9 Chapters · 50 Topics · 394 Videos
Discover Our Learning Areas
Explore key subjects and start learning with interactive content.





What Is AP Statistics?
AP Statistics is a college-level course and exam offered through the College Board that introduces students to the major concepts and tools for collecting, analyzing, and drawing conclusions from data. In one sentence: AP Statistics teaches you to think statistically — to ask the right questions about data, design fair studies, model randomness with probability, and use inference to make decisions backed by evidence.
The course is widely taken in Grade 12 across Canada and the United States, and a strong AP exam score (typically 3 or higher) can earn university credit in statistics, saving students both time and tuition in their first year of post-secondary study.
What Topics Are Covered in AP Statistics?
AP Statistics is organized around four broad conceptual themes that the College Board calls "Big Ideas": Variation and Distribution, Patterns and Uncertainty, Data-Based Predictions and Conclusions, and Statistical Argumentation. In practice, the course covers:
- Exploring One-Variable Data — shape, centre, spread, and outliers in distributions; comparing dotplots, histograms, and boxplots.
- Exploring Two-Variable Data — scatterplots, correlation, and linear regression; residuals and the least-squares line.
- Collecting Data — sampling methods, experimental design, and sources of bias.
- Probability and Random Variables — rules of probability, discrete and continuous distributions, binomial and geometric models.
- Sampling Distributions — the Central Limit Theorem and what it means for inference.
- Statistical Inference — confidence intervals and significance tests for proportions and means; chi-square tests; inference for regression slopes.
Each unit builds on the last, so a shaky understanding of probability will undermine your work in inference. That is why identifying gaps early — with a diagnostic — matters so much in this course.
Is AP Statistics Hard? Where Do Students Struggle Most?
AP Statistics sits at an interesting difficulty level: the arithmetic is lighter than AP Calculus, but the conceptual and written demands are heavier. The AP exam's free-response section asks you to justify every conclusion in context, using precise statistical language. Students who approach Statistics like a pure math course — focusing only on getting a number — often lose marks on the exam because they cannot explain what the number means.
The three areas where students struggle most are:
- Hypothesis testing procedure — knowing which test to use (z, t, chi-square, or regression t) and writing the four-step conclusion completely and in context.
- Interpreting confidence intervals and p-values — the formal wording is counterintuitive, and even small deviations from the approved phrasing cost marks.
- Experimental design questions — identifying confounding variables, explaining randomization, and distinguishing observational studies from experiments.
The good news: all three are highly learnable with clear instruction and repeated practice on exam-style problems. StudyPug's certified-teacher video lessons teach the standard method for each procedure, then adaptive practice reinforces it until the reasoning becomes automatic.
How Does the AP Statistics Exam Work?
The AP Statistics exam runs for approximately three hours and is divided into two sections:
- Section I — Multiple Choice (40 questions, 90 minutes): covers all units; accounts for 50% of the composite score.
- Section II — Free Response (6 questions, 90 minutes): five shorter questions plus one extended investigative task; accounts for the other 50%.
Scores are reported on a 1–5 scale. In Canada, most universities accept a score of 3 or better for credit or advanced standing in introductory statistics courses; some competitive programs require a 4. The exam is administered each May; check the College Board website for the current year's date.
Preparing with AP exam-style practice questions — the kind StudyPug provides in its practice sets — is the single most effective way to improve your free-response score, because you learn the expectations before test day.
Why StudyPug for AP Statistics Help?
StudyPug is built around three things that AP Statistics students need most: finding their gaps, understanding the method, and practising until it holds.
Diagnostic Assessment: Before you watch a single video, a quick diagnostic identifies the exact AP Statistics topics where you are losing marks. This means you spend your study time on hypothesis testing or regression — whichever actually needs work — instead of reviewing material you already know.
Certified-Teacher Video Lessons: Every lesson is made by a certified teacher, not generated by AI. The focus is always on the method: why you set up a hypothesis test this way, what the conditions check is actually telling you, how to write a conclusion the AP examiner will accept. Once you understand the why, you can apply it to problems you have never seen before — which is exactly what the AP exam tests.
Adaptive Practice: After a lesson, practice problems adjust to your performance level. If you are finding chi-square tests easy, the difficulty increases. If you are making consistent errors on inference for regression, the system keeps routing questions there until you are ready to move on. This keeps every practice session efficient and targeted.
AP Exam-Style Test Prep: Practice sets are built around AP Statistics topics and formatted to match what you will see on the exam — both multiple-choice and free-response reasoning prompts. Practising in exam conditions before the actual test is the fastest way to build the calm, methodical approach that earns high free-response scores.
Free Practice Content: You can access practice problems on StudyPug without a subscription — no credit card required. It is a genuine, low-friction way to start improving your AP Statistics skills right now.
30-Day Money-Back Guarantee: Every paid plan is backed by a 30-day money-back guarantee. There is no free trial of the subscription, but you take no financial risk in your first month.
What You Learn — AP Statistics Curriculum Coverage
StudyPug's AP Statistics content covers the full College Board curriculum, organized by unit so you can work through topics in the same order your class does or jump directly to whatever you are studying this week.
Coverage includes all major unit themes: exploring one- and two-variable data, collecting data through sampling and experimental design, probability and random variables (including binomial and geometric distributions), sampling distributions and the Central Limit Theorem, and the full range of inference procedures — one-sample and two-sample tests for means and proportions, chi-square goodness-of-fit and independence tests, and inference for regression slopes.
Each topic has its own video lesson, worked example, and adaptive practice set. Whether you are working ahead of your class or catching up before the AP exam, you can find the exact topic and get a step-by-step lesson within minutes.
Note: No validated internal topic-page links are available for this course in the current site map. Browse all AP Statistics topics directly at studypug.com/ca/ca-ap-statistics/.
How to Use StudyPug for AP Statistics
Most students get the best results from a simple three-step routine:
- Run the diagnostic. Before your next unit test or before you start AP exam review, take the diagnostic assessment. It will tell you in a few minutes exactly which topics to prioritize — saving hours of unfocused studying.
- Watch the lesson, focus on the method. For each flagged topic, watch the certified-teacher video. Pause when the teacher works through the procedure and try the step yourself before watching the solution. This active watching is what builds the pattern recognition the AP exam rewards.
- Practise until it sticks. Work through the adaptive practice set for that topic. If you get questions wrong, the system routes you back with similar problems at a slightly easier level, then rebuilds difficulty as you improve. By the time you feel confident, you will have solved enough variations that the procedure is automatic.
Many AP Statistics students also find it helpful to use StudyPug the night before a unit test — watching the lesson for the specific inference procedure being tested and then doing 10–15 practice problems in exam format. The 24/7 availability means this works at 11 p.m. the evening before the test just as well as it does on a Sunday afternoon two weeks out.
Start with the diagnostic today and find out exactly where to focus your AP Statistics preparation.
AP Statistics FAQ
Unsure how StudyPug works? Need help with setting up? Check our frequently asked questions or contact us for help.
What do you learn in AP Statistics, and what topics does it cover?
AP Statistics covers five major themes: exploring data (describing distributions and relationships), sampling and experimentation (how data are collected), probability (chance behaviour and random variables), statistical inference (confidence intervals and significance tests), and regression (modeling relationships between variables). By the end of the course you can design studies, analyze data, and draw conclusions using evidence — skills tested directly on the AP exam each May.
What is the difference between AP Statistics and AP Calculus?
AP Statistics focuses on data analysis, probability, and drawing conclusions from real-world information — it is less about computation and more about reasoning and interpretation. AP Calculus (AB or BC) is about rates of change, limits, and integration, relying heavily on algebraic manipulation. Statistics asks "what does the data tell us?"; Calculus asks "how does this quantity change?". Many students take both, but Statistics is often considered more accessible to students who are stronger in reasoning than in pure algebra.
Is AP Statistics hard, and where do students struggle most?
AP Statistics is challenging primarily because it requires precise written explanations, not just numerical answers. The free-response section rewards students who can justify every conclusion in context. Common sticking points include understanding when to use each inference procedure (z-test vs. t-test vs. chi-square), interpreting p-values correctly, and distinguishing correlation from causation. With consistent practice and clear video explanations covering the reasoning behind each method, most students find these concepts manageable.
What should I take before AP Statistics, and what comes after it?
Most students enter AP Statistics having completed Algebra 2 or Pre-Calculus; a strong grasp of linear equations and basic probability helps. AP Statistics does not require Calculus. After AP Statistics, common next steps include introductory university statistics, data science, or economics courses. A score of 3 or higher on the AP exam often earns college credit in Canada and the US, giving you a head start in university programs across business, science, social science, and engineering.
Is AP Statistics on the AP exam, and how is it tested?
Yes. The AP Statistics exam is administered by College Board each May. It consists of two sections: a 40-question multiple-choice section (50% of the score) and a free-response section with five short questions plus one investigative task (50% of the score). The investigative task requires extended written reasoning. Scores run from 1 to 5; many Canadian universities and programs accept a score of 3 or better for credit or advanced standing.
What is one of the hardest concepts in AP Statistics, and how do you tackle it?
Hypothesis testing is consistently the most difficult concept for AP Statistics students. The challenge is not the arithmetic — it is writing a complete four-step procedure (hypotheses, conditions, test statistic, conclusion in context) without losing marks for vague language. The key is to practise writing full conclusions repeatedly: state the p-value, compare it to alpha, and write a sentence that names the parameter and references the original context. StudyPug's certified-teacher videos demonstrate this exact method on multiple question types so you can see the pattern before the exam.





Written by the StudyPug Team
Last updated June 5, 2026
3 M+
students
★★★★★
4.8 average
K–12
all grades