TOPIC
MY PROGRESS
Pug Score
0%
Best Streak
0 in a row
Study Points
+0
Overview
Practice
Watch
Read
Next Steps
Get Started
Get unlimited access to all videos, practice problems, and study tools.
Back to Menu
Topic Progress
Pug Score
0%
Videos Watched
0/0
Best Practice
No score
Read
Not viewed
Best Streak
0 in a row
Study Points
+0
Overview
Practice
Watch
Read
Next Steps
Read
Graphing linear functions using table of values
In order to graph linear function, we can make use of the table of values to map out the corresponding values of x and y for the given line. An equation is essentially a representation of the relationship of x and y values for any line. A table of values is basically a table which lists the values of y, given the x values, for the given line.
What is a table of values
When we have to graph out a linear equation, you'll start by creating a table of values. A table of values, as its name suggests, is a graphical way to determine the values that will be used to create your graph. It's a place for you to jot down the answers you get when you find the value of x and y. You'll need to use at least 2 sets of points to graph out a linear equation, but you will usually do more in a table of values.
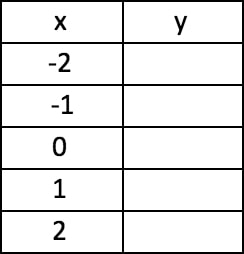
A table of values has two columns. One column lists the x values, and one column lists the corresponding y values. Let's move on to finding out how this table can be used to help us graph out linear equations.
Graphing linear equations using a table of values
When you've got a blank table of values and a linear equation that you want to graph out, you can take any x value on the x axis of your choosing to start off your table. Let's say you take the number 3. Substitute that into the linear equation to see what you'll get when you solve for y on the y axis. Let's pretend that you get -5. Jot down both of these numbers into your table, with 3 on the column with x values and -5 on the column for y values.
Choose another x value you want to work with and solve for y again. Repeat as many times as you wish to work out sets of values to put into your table. When you've got an amount you're happy with or that your question asks for, you can then take those x and y values and plot them out as coordinates on a graph to graph points on a linear equation!
Example problems
Question 1:
Graph following function using a table of values
y = 3x - 1
Solution:
First, create a table of values for the equation. Use x to solve for y. You may use different values, but your graph will be the same no matter what values you use.
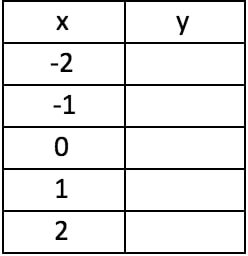
For x = -2
y = 3(-2) - 1
y = -6 - 1
y = -7
For x = -1
y = 3(-1) - 1
y = -3 - 1
y = -4
For x = 0
y = 3(0) - 1
y = 0 - 1
y = -1
For x = 1
y = 3(1) - 1
y = 3 - 1
y = 2
For x = 2
y = 3(2) - 1
y = 6 - 1
y = 5
Now, we have a complete table of values
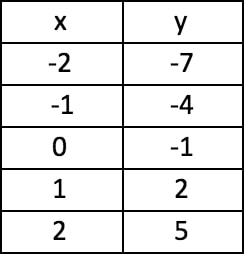
We can now plot the ordered pairs onto a grid
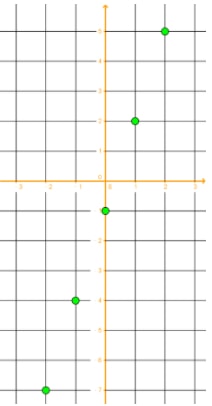
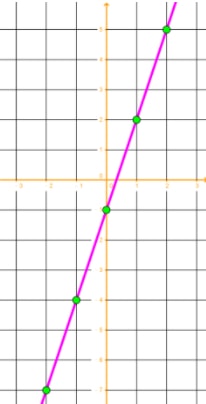
Then, connect the points using a straight line, and we are done!
Question 2:
Graph the following function using a table of values:
2x + 4y = 8
Solution:
First, we want to simplify the equation
2x + 4y = 8
x + 2y = 4
2y = -x + 4
y = \(\frac{-1}{2}\)x + 2
Now we've got an equation in slope-intercept form.
Then, create a table of values for the equation. Use x to solve for y.
For x = -2
y = \(\frac{-1}{2}\)(-2) + 2
y = 1 + 2
y = 3
For x = -1
y = \(\frac{-1}{2}\)(-1) + 2
y = 0.5 + 2
y = 2.5
For x = 0
y = \(\frac{-1}{2}\)(0) + 2
y = 0 + 2
y = 2
For x = 1
y = \(\frac{-1}{2}\)(1) + 2
y = -0.5 + 2
y = 1.5
For x = 2
y = \(\frac{-1}{2}\)(2) + 2
y = -1 + 2
y = 1
Now, we have a complete table of values
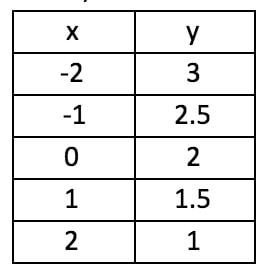
We can plot the ordered pairs onto a grid.
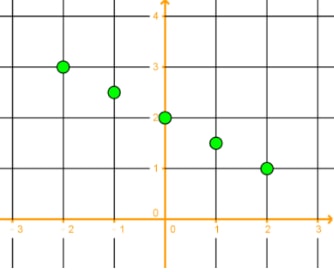
Then, connect the points using a straight line, and we are done!
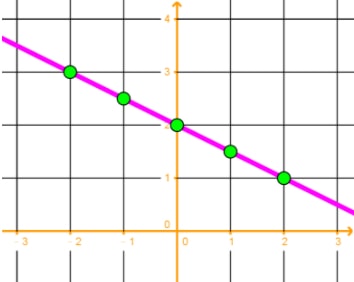
Want to check your answer to see how accurate your graph is? Here's an online graphing calculator for your reference.
Next up, learn more about table of values, how to graph linear inequalities in two variables, and how to graph systems of linear inequalities. You can also start learning an introduction to functions and how to identify them.