Plotting a working hours vs. earnings table on a graph
📝 My Notes
Auto-saves the current timestamp
Plotting a working hours vs. earnings table on a graph
1:37
About this lesson
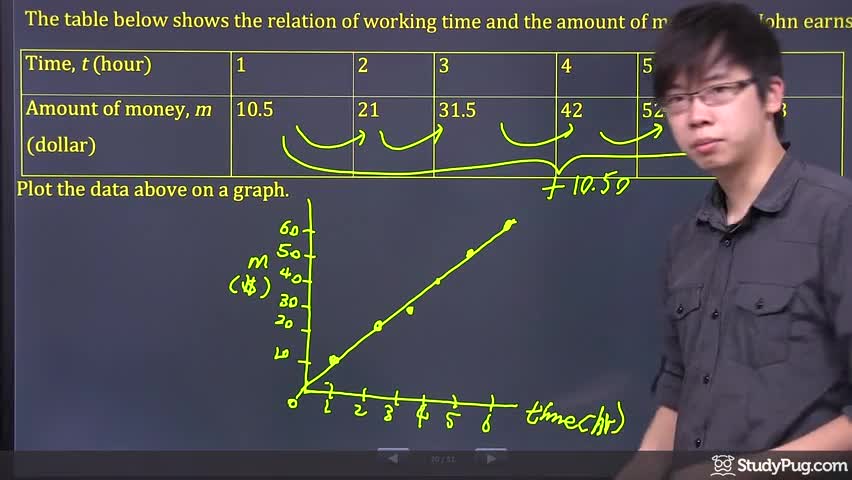
The table below shows the relation of working time and the amount of money that John earns.
|
Time, t (hour) |
1 |
2 |
3 |
4 |
5 |
6 |
|
Amount of money, m (dollar) |
10.5 |
21 |
31.5 |
42 |
52.5 |
63 |
Key Moments
No key moments available.
Video 1 of 8
Plotting a working hours vs. earnings table on a graph
2 min
• Selected
Finding earnings at 3.5 hours by reading the graph
2 min
Finding how long it takes to earn $50 using the graph and equation
2 min
Plotting a scuba diver's depth vs. time on a graph
1 min
Finding dive distance at 40 minutes using a linear equation
4 min
Finding the time when the diver reaches negative 35 meters
1 min
Finding profit from selling 55 t-shirts using a graph and equation
3 min
Finding how many T-shirts to sell to earn $200
2 min