TOPIC
MY PROGRESS
Pug Score
0%
Getting Started
"Let's build your foundation!"
Study Points
+0
Overview
Watch
Next Steps
Get Started
Get unlimited access to all videos, practice problems, and study tools.
Unlimited practice
Full videos
BACK TO MENU
Topic Progress
Pug Score
0%
Getting Started
"Let's build your foundation!"
Videos Watched
0/0
Study Points
+0
Overview
Watch
Next Steps
Watch
Example 1a
📝 My Notes
Auto-saves the current timestamp
Example 1a
3:59
About this lesson
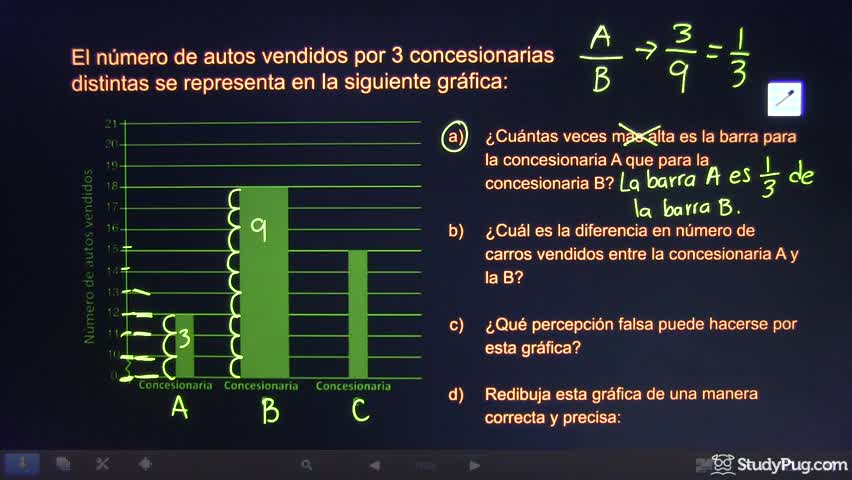
El número de autos vendidos por 3 concesionarias distintas se representa en la siguiente gráfica:
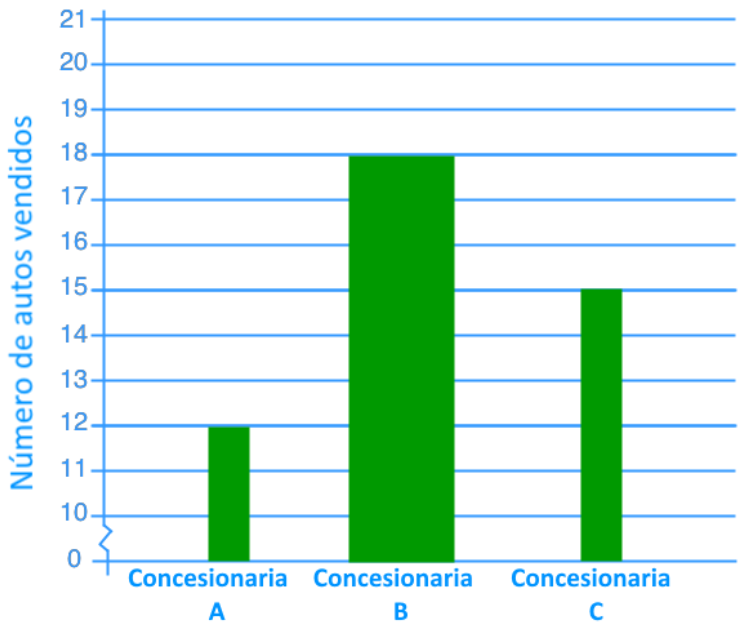
¿Cuántas veces más alta es la barra para la concesionaria A que para la concesionaria B?
Key Moments
No key moments available.
Video 1 of 7
Example 1a
4 min
• Selected
Example 1b
1 min
Example 1c
4 min
Example 1d
6 min
Example 2a
2 min
Example 2b
2 min
Example 2c
2 min