Overview
Watch
Read
Next Steps
Watch
Intro to titration curves and reading their key features
📝 My Notes
Auto-saves the current timestamp
Intro to titration curves and reading their key features
3:27
About this lesson
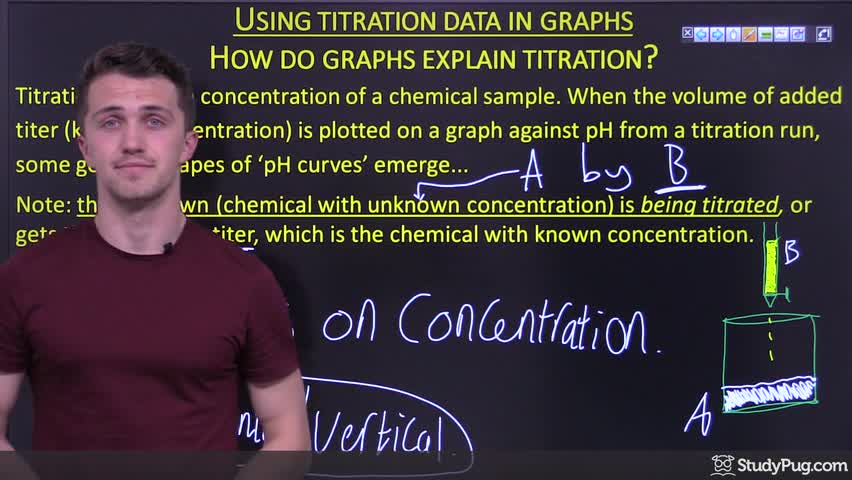
Using titration data in graphs
How do graphs explain titration?
Key Moments
No key moments available.
Video 1 of 7
Intro to titration curves and reading their key features
3 min
• Selected
Three phases of a strong acid-strong base titration curve
5 min
Weak acid titrated by strong base titration curve
4 min
Weak base titrated by strong acid curve explained
3 min
Choosing the right indicator for different titration types
3 min
Choosing phenolphthalein as a pH indicator for titrations
4 min
Drawing a weak acid-strong base titration curve
4 min