Intro to histograms: reading continuous data and frequency ranges
Intro to histograms: reading continuous data and frequency ranges
4:25
About this lesson
Key Moments
No key moments available.
Video 1 of 12
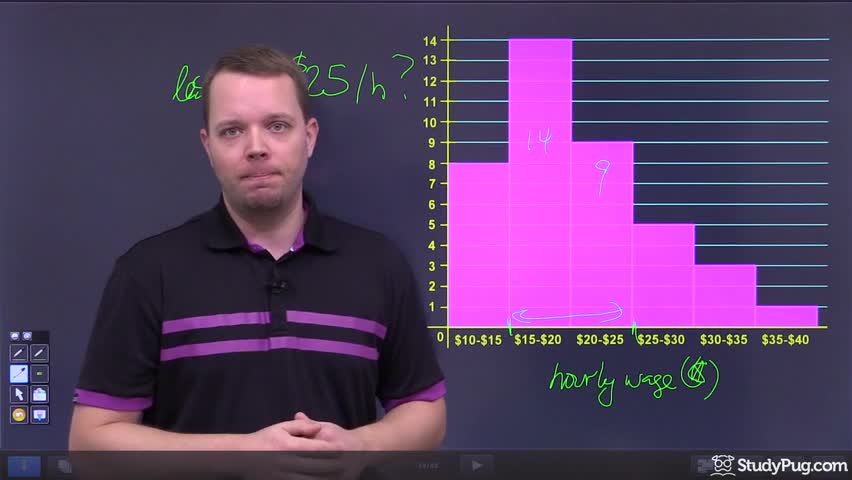
Intro to histograms: reading continuous data and frequency ranges
4 min
• Selected
How to build and draw a histogram from raw data
11 min
Finding the number of days for a specific interval on a histogram
3 min
Comparing two histogram intervals to find which has more days
4 min
Identifying the shape of a histogram distribution
5 min
Drawing a histogram from a frequency table of outdoor time
6 min
Finding total days within a range using a frequency table
4 min
Building a frequency table from clothing purchase survey data
9 min
Completing a histogram using a frequency table from survey data
6 min
Finding the most common range of clothing purchases from a frequency table
1 min
Calculating the percentage of people who bought 9 or more items
5 min
Building a histogram from data and identifying a right-skewed distribution
7 min