TOPIC
MY PROGRESS
Pug Score
0%
Best Streak
0 in a row
Study Points
+0
Overview
Practice
Watch
Read
Quiz
Next Steps
Get Started
Get unlimited access to all videos, practice problems, and study tools.
Back to Menu
Topic Progress
Pug Score
0%
Videos Watched
0/0
Best Practice
No score
Read
Not viewed
Best Quiz
No attempts
Best Streak
0 in a row
Study Points
+0
Overview
Practice
Watch
Read
Quiz
Next Steps
Read
How to Read a Line Graph: Essential Skills for Data Analysis
In this article, we've explored the essential elements of line graphs, from their basic components to practical interpretation techniques. We've covered how to identify trends, compare data sets, and extract meaningful insights from these visual representations. The introduction video serves as a crucial foundation, offering a clear and concise overview of line graph fundamentals. Remember, mastering line graphs is a skill that improves with practice. We encourage you to apply these concepts to real-world examples and datasets. As you gain confidence, consider exploring more complex graph types to expand your data visualization repertoire. By honing your ability to read and interpret line graphs, you'll enhance your analytical skills and decision-making capabilities across various fields. Keep practicing, stay curious, and continue to develop your graphical literacy it's an invaluable asset in our data-driven world.
Reading and Drawing Line Graphs
Mrs. K created a graph to keep track of attendance in her classroom over a week.
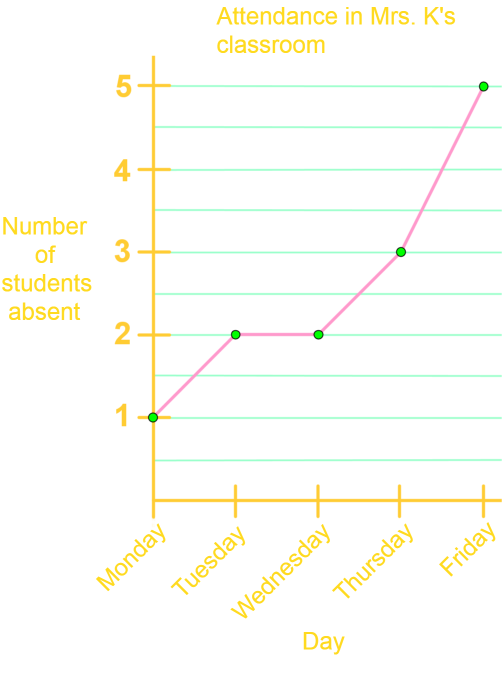
On which days were exactly 2 students absent?
Step 1: Understanding the Graph
First, we need to understand the type of graph presented. This is a line graph, which consists of data points connected by straight lines. Line graphs are used to observe how data changes over time. In this case, the graph shows the number of students absent each day over a week.
Step 2: Identifying the Data Points
Next, we need to identify the data points on the graph. Each point on the graph represents the number of students absent on a particular day. The x-axis represents the days of the week, and the y-axis represents the number of students absent.
Step 3: Analyzing the Data
We need to analyze the data to find out on which days exactly 2 students were absent. We start by looking at the y-axis and finding the value '2'. Then, we trace this value horizontally across the graph to see where it intersects with the data points.
Step 4: Observing the Intersections
By observing the intersections, we can see that the line graph intersects the value '2' on the y-axis at two points. These points correspond to the days on the x-axis. We need to identify these days.
Step 5: Identifying the Days
From the graph, we can see that the line intersects the value '2' on the y-axis on Tuesday and Wednesday. Therefore, exactly 2 students were absent on these two days.
Step 6: Conclusion
In conclusion, by carefully analyzing the line graph, we determined that exactly 2 students were absent on Tuesday and Wednesday. This method can be applied to any similar line graph to find specific data points.
FAQs
Here are some frequently asked questions about reading and understanding line graphs:
1. How do you read a graph for beginners?
To read a graph as a beginner, start by identifying the title and axis labels. Look at the x-axis (horizontal) and y-axis (vertical) to understand what's being measured. Observe the overall trend of the line(s) and note any significant changes or patterns. Pay attention to the scale and units used on both axes.
2. How do you read a line graph for kids?
For kids, explain that a line graph shows how things change over time. Point out that the bottom line (x-axis) usually shows time, while the side line (y-axis) shows the amount of something. Encourage them to follow the line with their finger, noting how it goes up (increases) or down (decreases).
3. How to explain line graph?
Explain that a line graph uses lines to show how data changes over time or across categories. The x-axis typically represents time or categories, while the y-axis shows the measured values. The line connects data points, and its slope indicates the rate of change. Multiple lines can be used to compare different sets of data.
4. How do you read two line graphs?
When reading two line graphs, first identify what each line represents using the legend. Compare the overall trends of both lines. Look for points where the lines intersect or diverge significantly. Pay attention to how each line responds to changes in the x-axis variable. Consider the relationship between the two variables and any potential correlations.
5. What are some common challenges in reading line graphs?
Common challenges include misinterpreting scales, confusing correlation with causation, difficulty comparing multiple lines, identifying outliers, and interpreting non-uniform time intervals. To overcome these, always check axis scales carefully, consider external factors, focus on one line at a time before comparing, investigate outliers, and pay close attention to time intervals on the x-axis.
Prerequisite Topics
Understanding the foundations of mathematics is crucial for mastering more advanced concepts. When it comes to reading and drawing line graphs, one essential prerequisite topic stands out: graphing from slope-intercept form y=mx+b. This fundamental skill is the cornerstone of interpreting and creating line graphs effectively.
The slope-intercept form of a linear equation, y=mx+b, is a powerful tool that directly relates to reading and drawing line graphs. In this equation, 'm' represents the slope of the line, which indicates the rate of change, while 'b' represents the y-intercept, the point where the line crosses the y-axis. Understanding these components is crucial for accurately interpreting and constructing line graphs.
When you grasp the concept of graphing from slope-intercept form, you develop a keen eye for identifying the slope of a line in various contexts. This skill is invaluable when reading line graphs, as it allows you to quickly assess trends and patterns in the data. Whether you're analyzing financial trends, scientific data, or any other information presented in a line graph, your ability to recognize and interpret slopes will greatly enhance your understanding.
Moreover, the y-intercept (b) in the slope-intercept form provides crucial information about the starting point of a line graph. This knowledge is particularly useful when drawing line graphs, as it helps you accurately plot the initial point and establish the graph's foundation. Understanding how to manipulate the y-intercept allows you to shift graphs vertically, a skill that's often required when comparing multiple data sets or adjusting for different baseline values.
The connection between graphing from slope-intercept form and reading and drawing line graphs extends beyond basic interpretation. It enables you to make predictions, extrapolate data, and even reverse-engineer equations from given graphs. These advanced skills are invaluable in fields such as economics, physics, and data science, where line graphs are frequently used to represent complex relationships.
By mastering this prerequisite topic, you'll develop a strong intuition for linear relationships, which is the essence of line graphs. This foundation will not only make reading and drawing line graphs more accessible but also enhance your overall mathematical reasoning. As you progress in your studies, you'll find that this knowledge seamlessly integrates with more advanced graphing techniques and data analysis methods.
In conclusion, investing time in understanding graphing from slope-intercept form is a crucial step towards mastering the art of reading and drawing line graphs. This prerequisite knowledge will empower you to approach line graphs with confidence, whether you're interpreting complex data sets or creating your own visual representations of linear relationships.