Overview
Watch
Next Steps
Watch
Example 1a
📝 My Notes
Auto-saves the current timestamp
Example 1a
22:35
About this lesson
|
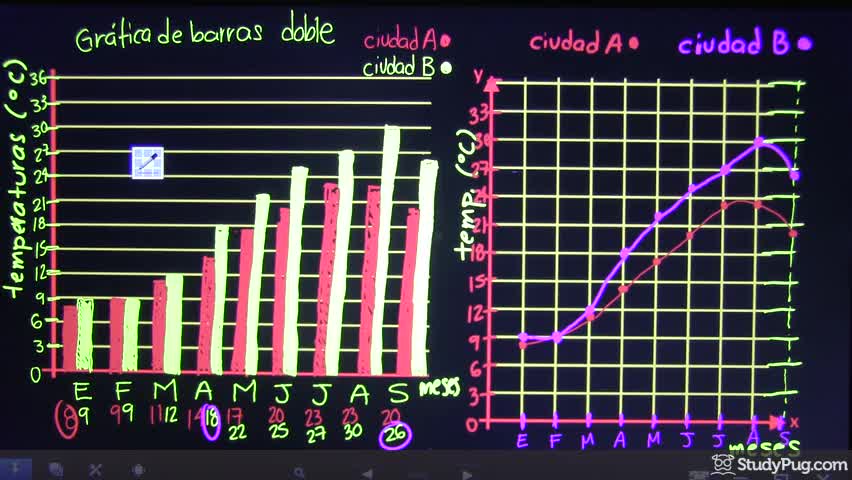
Mes |
Ene |
Feb |
Mar |
Abr |
May |
Jun |
Jul |
Ago |
Sep |
|
Temp. (°C) |
8 |
9 |
11 |
14 |
17 |
20 |
23 |
23 |
20 |
Ciudad \(B\)
|
Mes |
Ene |
Feb |
Mar |
Abr |
May |
Jun |
Jul |
Ago |
Sep |
|
Temp. (°C) |
9 |
9 |
12 |
18 |
22 |
25 |
27 |
30 |
26 |

Key Moments
No key moments available.
Video 1 of 4
Example 1a
23 min
• Selected
Example 1b
6 min
Example 1c
5 min
Example 1d
9 min