Statistics Help: Video Lessons & Practice
Work through every topic with clear solutions. Start your free practice test now!
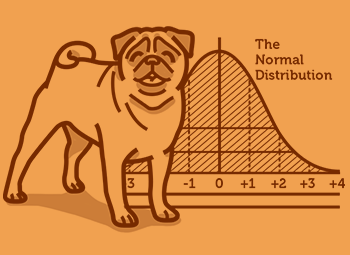
Value vs. Private Tutor
Expert teaching without the tutor cost.

Multi-Subject
Switch from Statistics to any subject.
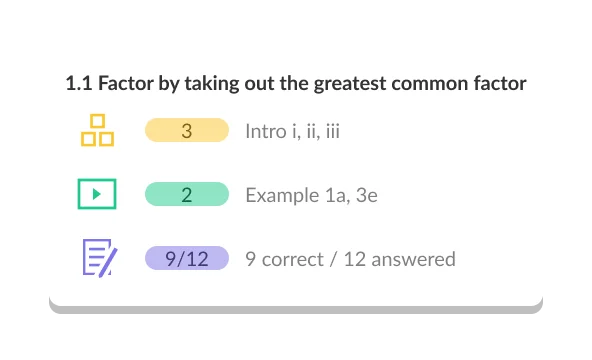
Practice Until Perfect
Practice until you truly master it.
Try It Now
Test your knowledge
Our approach aligns with the evidence
Exam Scores
Better Recall
Less Anxiety
Statistics Topics
1. Basic Concepts
2. Data Representation
3. Data Interpretation
4. Discrete Probabilities
5. Normal Distribution and Z-score
6. Confidence Intervals
7. Combinatorics
8. Probability
9. Set Theory
10. Hypothesis Testing
10 Chapters · 62 Topics · 516 Videos
Discover Our Learning Areas
Explore key subjects and start learning with interactive content.







What is University Statistics?
University Statistics is the systematic study of how to collect, organize, analyze, and interpret data to draw meaningful conclusions. In a single sentence: Statistics gives you a principled framework for making decisions under uncertainty — a skill that underpins every research-driven discipline from economics to medicine to engineering.
At the introductory university level, Statistics sits at the intersection of mathematics and practical reasoning. Students learn to move from raw numbers to reliable inferences, building the quantitative literacy that employers and graduate programs increasingly expect. For Canadian university students, a strong Statistics foundation also feeds directly into upper-year courses in data science, econometrics, epidemiology, and research methods.
Is university Statistics harder than high school Statistics?
Yes — university Statistics is meaningfully harder, and the jump catches many students off guard. High school Statistics focuses on procedures: calculate the mean, draw the histogram, identify the outlier. University Statistics asks why those procedures work and when they break down.
The biggest shift is conceptual. You will spend significant time on probability theory and sampling distributions — the mathematical machinery that makes inference possible. Understanding why a t-distribution is used instead of a z-distribution, or what a p-value actually tells you (and what it does not), requires a different kind of thinking than simply plugging numbers into a formula. Students who treat Stats as a purely computational course tend to struggle in the second half of the semester when hypothesis testing and regression analysis dominate. The remedy is consistent engagement with worked examples and practice problems throughout the course, not just before exams.
What are the most important topics in university Statistics?
Every Canadian university Statistics course varies slightly by department and program, but the following topics appear almost universally:
Descriptive statistics and data visualization — summarizing data with measures of centre and spread, interpreting histograms, box plots, and scatter plots. This material feels approachable but sets up everything that follows.
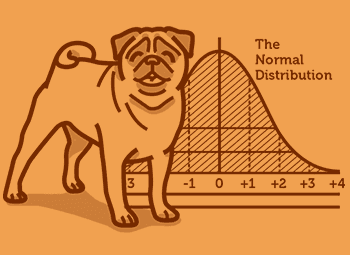
Probability and probability distributions — the normal, binomial, and Poisson distributions are the workhorses of applied Statistics. Understanding their properties and when to use each one is essential.
Sampling distributions and the Central Limit Theorem — this is where many students first feel lost, because the logic is subtle. The CLT is the bridge between descriptive and inferential Statistics, and it reappears in every hypothesis test you will ever run.
Confidence intervals and hypothesis testing — the core of inferential Statistics. Setting up null and alternative hypotheses, choosing the right test (z, t, chi-square, F), calculating the test statistic, interpreting the p-value, and communicating results clearly. This section alone accounts for a large share of most Statistics midterms and finals.
Regression analysis — simple linear regression and its extensions. Understanding coefficient interpretation, model fit, and regression diagnostics is critical for data-driven courses that follow.
More advanced first-year courses also introduce ANOVA, non-parametric tests, and elements of experimental design.
What comes after university Statistics?
Completing introductory Statistics opens a wide range of upper-year paths. In mathematics and statistics departments, students typically move into Mathematical Statistics (a more rigorous, proof-based treatment), Probability Theory, Stochastic Processes, and eventually Bayesian Statistics or Time Series Analysis. In economics programs, Econometrics is the natural next step. In biology and health sciences, Biostatistics builds on exactly the same foundations using medical and experimental data. Computer science and data science programs build toward Machine Learning and Statistical Computing. Whichever direction you head, the concepts you learn in your first Statistics course — distributions, inference, regression — will resurface in every subsequent course. Getting them right the first time pays dividends for years.
Why StudyPug for Statistics help?
StudyPug is built for university students who need more than a textbook: you need clear explanations, targeted practice, and fast feedback — especially in the weeks before midterms and finals.
Diagnostic assessment that saves time. Before you spend hours reviewing material you already understand, StudyPug's diagnostic assessment identifies precisely which Statistics topics need attention. That means your study time goes where it will have the most impact — not scattered across the entire course.
Certified-teacher video lessons that teach the method. Every Statistics lesson on StudyPug is taught by an experienced, certified teacher — not generated by AI. The lessons walk through the reasoning behind each technique, so you understand why hypothesis testing works the way it does, not just how to execute the steps. That depth of understanding is what separates students who perform well on straightforward exam questions from those who can also handle unfamiliar problems.
Adaptive practice that grows with you. Once you start practising, the difficulty adjusts to your performance. Early in a topic the problems build foundational fluency; as you improve, the practice pushes toward exam-level challenges. This is a more efficient path to readiness than working through a static problem set from start to finish.
Mock exams and exam-prep resources. Practice tests and mock exams based on real university Statistics formats help you prepare specifically for Canadian university midterms and finals. Working through timed, full-length practice exams before the real thing is one of the most reliable ways to reduce exam anxiety and improve performance.
One subscription, every course. Statistics is included in your StudyPug subscription alongside Calculus I–III, Linear Algebra, Differential Equations, and every other university course on the platform. When your courseload changes next semester, your access does not.
What Statistics topics does StudyPug cover?
StudyPug's university Statistics content covers the full scope of a standard first-year Canadian university Statistics course and extends into more advanced material. Core coverage includes:
- Descriptive statistics: mean, median, mode, variance, standard deviation, IQR
- Data visualization: histograms, box plots, scatter plots, frequency distributions
- Probability fundamentals: rules of probability, conditional probability, Bayes' theorem
- Probability distributions: normal, binomial, Poisson, t-distribution, chi-square, F-distribution
- Sampling distributions and the Central Limit Theorem
- Confidence intervals for means and proportions
- Hypothesis testing: z-tests, t-tests (one-sample, two-sample, paired), chi-square tests, F-tests
- Correlation and simple linear regression
- Multiple regression and regression diagnostics
- ANOVA (one-way and two-way)
- Non-parametric tests
Because no validated topic URLs are currently available in the internal link map for this page, the best way to explore available lessons is to browse the Statistics course page directly on StudyPug and use the topic list to find exactly what you need.
How to use StudyPug for Statistics
Start with the diagnostic. Run the diagnostic assessment at the beginning of the semester or as soon as you hit difficulty. It takes only a few minutes and produces a clear picture of where your gaps are — hypothesis testing, distributions, regression, or elsewhere.
Watch the lesson, then practise immediately. For each topic, watch the certified-teacher video lesson first to understand the concept and method. Then move directly into practice problems while the explanation is fresh. Adaptive practice will adjust the difficulty as you work, so you are always challenged at the right level.
Use mock exams to prepare for midterms and finals. Two to three weeks before your exam, start working through Statistics practice tests under timed conditions. Review every solution you got wrong, identify the underlying concept you missed, and revisit the relevant lesson. Repeat until you can work through a full practice test without consulting solutions.
Watch solutions on any device. StudyPug works on desktop, tablet, and mobile — so you can watch a solution on the bus, practise between lectures, or review a confidence-interval example the night before a test. There is no limit on how many times you can watch a lesson, so you can return to tricky topics as many times as you need until they click.
Use free practice to get started today. You can begin with free practice problems and a free practice test right now — no subscription required. When you are ready for unlimited access to every Statistics lesson, adaptive practice set, and mock exam, a paid plan is available with a 30-day money-back guarantee.
Statistics FAQ
Unsure how StudyPug works? Need help with setting up? Check our frequently asked questions or contact us for help.
What do you learn in university Statistics, and what topics does it cover?
University Statistics covers the core tools for collecting, analyzing, and interpreting data. Topics typically include descriptive statistics, probability theory, probability distributions (normal, binomial, Poisson), sampling methods, confidence intervals, hypothesis testing, correlation, simple and multiple regression, and — in more advanced courses — ANOVA, chi-square tests, and non-parametric methods. Canadian university Statistics courses often feed directly into research methods, data science, economics, and health-science programs, making a strong foundation essential from day one.
What is the difference between Statistics and Biostatistics?
Statistics is the general discipline covering data analysis methods applicable across all fields. Biostatistics is a specialized branch that applies those same methods to biological, medical, and public-health data. You will encounter survival analysis, clinical trial design, and epidemiological study design in Biostatistics, which are not always covered in a general Stats course. Most of the foundational concepts — hypothesis testing, regression, distributions — are shared, so a solid grounding in university Statistics helps you transition into Biostatistics with far less friction.
What are the prerequisites for Statistics, and what course comes after it?
Most Canadian university introductory Statistics courses require at least one semester of calculus or a strong pre-calculus background, though some social-science sections are calculus-free. A solid grasp of algebra and basic probability helps. After introductory Statistics, students typically progress to courses such as Regression Analysis, Mathematical Statistics, Probability Theory, Stochastic Processes, or Econometrics, depending on their program. Data Science and Machine Learning courses at the third and fourth year also build heavily on the foundations laid in first-year Stats.
Is university Statistics hard, and where do students struggle most?
Statistics is considered moderately to quite challenging, especially for students who expect it to be purely computational. The conceptual leap — understanding what a p-value actually means, or when to apply which test — trips up many students. Common struggle points include hypothesis testing logic (Type I vs. Type II errors), choosing the correct test, interpreting confidence intervals accurately, and understanding sampling distributions. Students also often find regression diagnostics and ANOVA tricky. Consistent practice with real data problems and reviewing worked solutions are the most effective ways to get past these sticking points.
How is university Statistics assessed — midterms, finals, and assignments?
In Canadian universities, Statistics courses are typically assessed through a mix of assignments or problem sets (20–30%), one or two midterm exams (30–40%), and a final exam (30–50%). Some courses include a data-analysis project or lab report. Final exams are cumulative and often held during the provincial university exam period. Many instructors pull questions from past exam banks, so practising with mock exams and working through topic-by-topic problem sets is one of the most reliable ways to prepare for both the midterm and the final.
What is one of the hardest topics in university Statistics, and how do you approach it?
Hypothesis testing is consistently the topic students find hardest. The difficulty is conceptual: you must understand the null and alternative hypothesis framework, calculate the correct test statistic, find or estimate the p-value, and then interpret results in plain language — all without confusing statistical significance with practical importance. The best approach is to learn each test type separately (z-test, t-test, chi-square, F-test), practise setting up the hypotheses before touching any numbers, and work through many examples with detailed solutions so the decision logic becomes second nature before exams.





Written by the StudyPug Team
Last updated June 5, 2026
3 M+
students
★★★★★
4.8 average
K–12
all grades