Overview
Watch
Read
Next Steps
Read
Box-and-Whisker Plots and Scatter Plots: Essential Data Visualization Tools
Box-and-whisker plots and scatter plots are essential tools in data visualization. Box plots provide a concise summary of data distribution, showing median, quartiles, and potential outliers. They're particularly useful for comparing multiple datasets side by side. Scatter plots, on the other hand, excel at revealing relationships between variables, allowing us to identify patterns, trends, and correlations. The introduction video plays a crucial role in enhancing understanding of these plot types. It offers a visual demonstration of how to construct and interpret these graphs, making abstract concepts more tangible. By watching the video, viewers can grasp the practical applications of box-and-whisker plots and scatter plots in real-world scenarios. This visual learning approach reinforces key concepts, helping students and professionals alike to better analyze and present data effectively. The video serves as a foundation for further exploration and application of these powerful data visualization techniques.
Box-and-Whisker Plot Analysis:
A box-and-whisker plot is shown below.
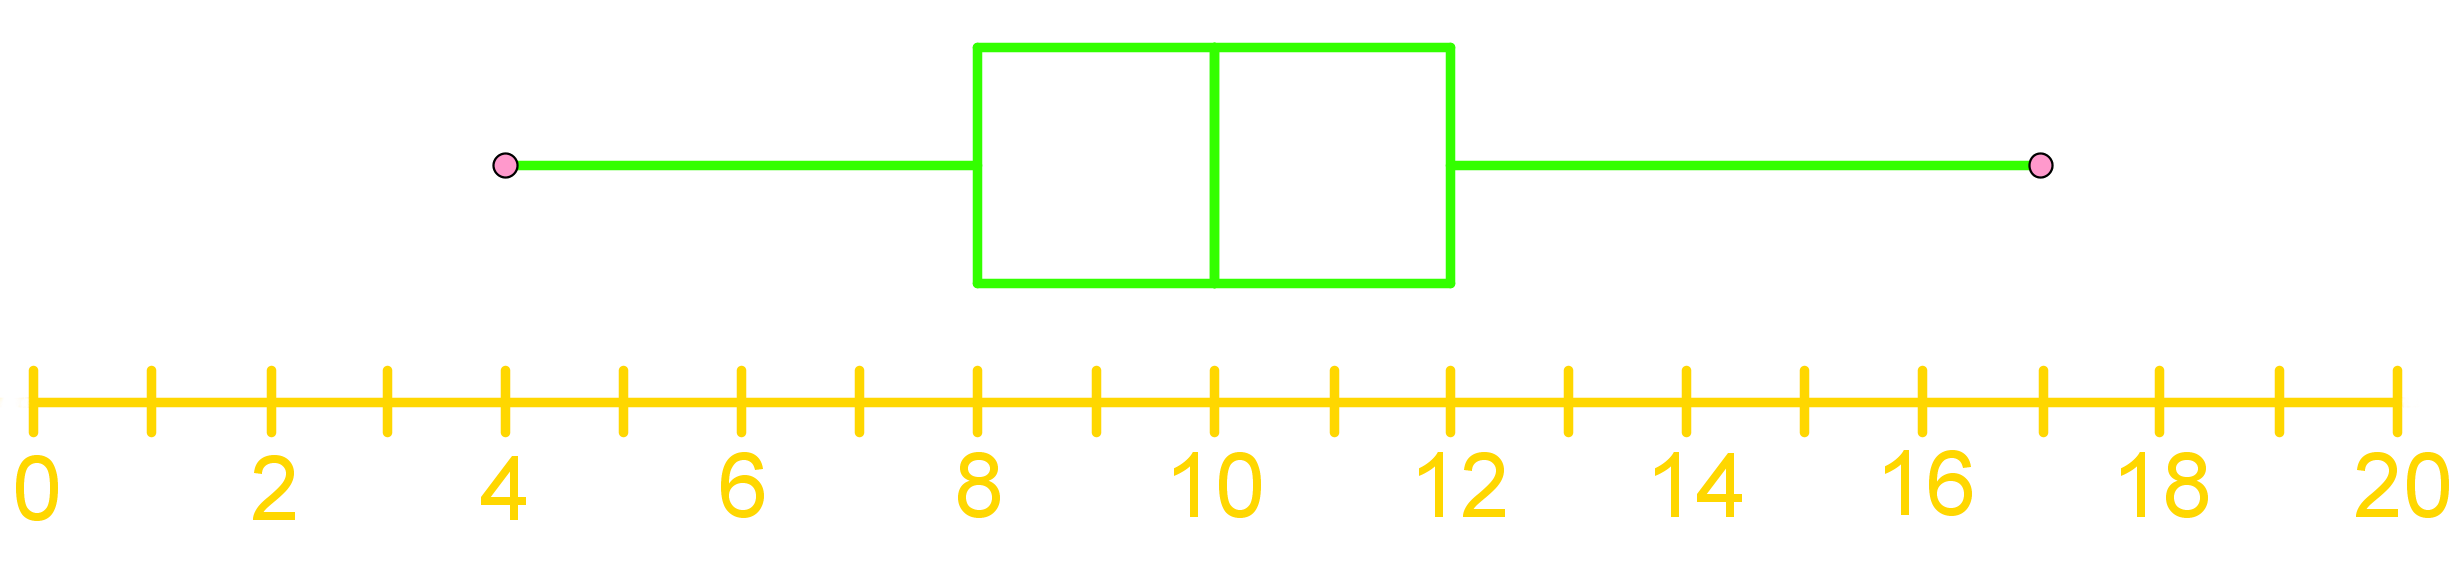
What is the maximum value?
Step 1: Understanding the Box-and-Whisker Plot
A box-and-whisker plot is a graphical representation used to display the distribution of a data set. It shows how data is spread out and provides a visual summary of the data's minimum, first quartile, median, third quartile, and maximum values. The plot consists of a box, which represents the interquartile range (IQR), and "whiskers" that extend to the minimum and maximum values.
Step 2: Identifying Key Components
To interpret a box-and-whisker plot, it's essential to identify its key components:
- Minimum Value: The smallest data point, represented by the leftmost point of the left whisker.
- First Quartile (Q1): The median of the lower half of the data set, marking the left edge of the box.
- Median (Q2): The middle value of the data set, represented by the line inside the box.
- Third Quartile (Q3): The median of the upper half of the data set, marking the right edge of the box.
- Maximum Value: The largest data point, represented by the rightmost point of the right whisker.
Step 3: Visualizing the Plot as a Cat's Face
To make it easier to understand, imagine the box-and-whisker plot as the face of a cat:
- The box represents the cat's nose.
- The line inside the box is the middle of the cat's nose.
- The whiskers extending from the box are the cat's whiskers.
Step 4: Locating the Maximum Value
The maximum value in a box-and-whisker plot is found at the far right tip of the right whisker. This point represents the highest data point in the data set. To determine the maximum value, follow these steps:
- Identify the right whisker of the plot.
- Locate the far right tip of the right whisker.
- Read the value directly below this point on the horizontal axis.
Step 5: Interpreting the Maximum Value
In the given box-and-whisker plot, the maximum value is located at the far right tip of the right whisker. By examining the plot, we can see that this point falls between 16 and 18 on the horizontal axis. Therefore, the maximum value is 17.
FAQs
-
What is the main difference between box-and-whisker plots and scatter plots?
Box-and-whisker plots summarize the distribution of a single dataset, showing median, quartiles, and potential outliers. Scatter plots, on the other hand, display the relationship between two variables by plotting individual data points on a two-dimensional graph. Box plots are ideal for comparing distributions across groups, while scatter plots excel at revealing correlations and patterns between two variables.
-
How do I interpret outliers in a box-and-whisker plot?
Outliers in a box-and-whisker plot are typically represented as individual points beyond the whiskers. They are data points that fall below Q1 - 1.5 * IQR or above Q3 + 1.5 * IQR, where IQR is the interquartile range. These points indicate unusual values in the dataset that may warrant further investigation or could potentially influence statistical analyses.
-
Can scatter plots show more than two variables?
While basic scatter plots display two variables, they can be modified to show additional variables. Color coding points can introduce a third variable, and varying point sizes can represent a fourth. These modifications transform the plot into a multi-dimensional visualization, allowing for more complex data representation and analysis.
-
What does the shape of a box-and-whisker plot tell us about data distribution?
The shape of a box-and-whisker plot provides insights into data distribution. A symmetrical box with the median line in the center suggests a normal distribution. If the median line is closer to one end of the box, it indicates skewness. The length of the box (IQR) and whiskers show the data's spread, with longer elements indicating greater variability.
-
How can I determine if there's a correlation in a scatter plot?
To determine correlation in a scatter plot, observe the overall pattern of points. A positive correlation is indicated by points trending upward from left to right, while a negative correlation shows points trending downward. The strength of the correlation is reflected in how closely the points follow a linear pattern. No clear trend suggests little to no correlation between the variables.
Prerequisite Topics
Understanding the foundation of statistical concepts is crucial when delving into more advanced topics like box-and-whisker plots and scatter plots. One essential prerequisite topic that plays a significant role in comprehending these graphical representations is Z-scores and random continuous variables. This fundamental concept serves as a building block for analyzing and interpreting data distributions, which is at the core of both box-and-whisker plots and scatter plots.
Z-scores, also known as standard scores, provide a standardized way to measure how far a data point is from the mean in terms of standard deviations. This concept is particularly relevant when working with box-and-whisker plots, as these plots visually represent the distribution of data, including measures of central tendency and spread. By understanding z-scores, students can better interpret the position of data points within the quartiles of a box plot and identify potential outliers.
Moreover, the concept of random continuous variables is fundamental to both box-and-whisker plots and scatter plots. Continuous variables can take on any value within a given range, which is often the type of data represented in these graphical formats. For instance, in a scatter plot, both the x and y axes typically represent continuous variables, allowing for the visualization of relationships between two variables across a continuous spectrum.
When students have a solid grasp of continuous variables analysis, they can more effectively interpret the patterns and trends displayed in scatter plots. This understanding helps in identifying correlations, clusters, or outliers within the data set. Similarly, for box-and-whisker plots, comprehending continuous variables aids in understanding the distribution of data across quartiles and the significance of the median and interquartile range.
Furthermore, the knowledge of z-scores becomes particularly useful when comparing data sets or identifying unusual values in both types of plots. In scatter plots, z-scores can help in standardizing variables on different scales, making comparisons more meaningful. For box-and-whisker plots, understanding z-scores aids in determining how extreme the whiskers or individual data points are relative to the overall distribution.
By mastering the concepts of Z-scores and random continuous variables, students lay a strong foundation for working with box-and-whisker plots and scatter plots. This prerequisite knowledge enhances their ability to create, interpret, and draw meaningful conclusions from these graphical representations. It also prepares them for more advanced statistical analyses and data visualization techniques, making the journey through statistics more coherent and interconnected.
In conclusion, the importance of understanding prerequisite topics like z-scores and random continuous variables cannot be overstated when studying box-and-whisker plots and scatter plots. These fundamental concepts provide the necessary context and analytical tools to fully appreciate and utilize these powerful data visualization methods in various fields of study and real-world applications.