TOPIC
MY PROGRESS
Pug Score
0%
Best Streak
0 in a row
Study Points
+0
Overview
Practice
Watch
Read
Quiz
Next Steps
Get Started
Get unlimited access to all videos, practice problems, and study tools.
Unlimited practice
Full videos
Back to Menu
Topic Progress
Pug Score
0%
Videos Watched
0/0
Best Practice
No score
Read
Not viewed
Best Quiz
No attempts
Best Streak
0 in a row
Study Points
+0
Overview
Practice
Watch
Read
Quiz
Next Steps
Read
Stem-and-leaf plots
To continue with our topics on data representation, it is time to introduce a new approach for graphing data which was created a few centuries ago to accommodate for the use of typewriters. Before computers and high definition graphics existed and were in the mainstream media, statisticians, and researchers in general, wanting to publish data graphic representations to communicate with broader audiences, came up with this clever method called the stem and leaf plot, which allowed graphics to be produced with regular typewriters.
Such method opened up the communication ways for data analysis by not requiring graphic art to represent data, just a simple table-style representation which not only was easily built while typewriting and emulated a histograms representation, but it could actually keep more details from the data being plotted than the frequency distribution representations we have seen before. Thus, out lesson of today focuses on stem and leaf plot statistics.
What is a stem and leaf plot
The stem and leaf plot is another way to represent data in a table-like manner. Stem and leaf plots may be not as intuitive as a frequency distribution table, but they do have advantages against them (which we will cover a little later), for the moment, let us look at the formal stem and leaf plot definition:
A stem and leaf plot is an organized, and position-conscious way to represent data that allows the observer to interpret all the characteristics of the data efficiently. On this kind of plot, the data is split in a two column table; the left column is the stem which contains the leftmost digits or highest multiples of ten in the data set values; then, the right column of the table is the stem and it provides a list of the rightmost digits of each value from the data set.
The concept of a stem and leaf plot of data may sound confusing, therefore, is better if you take a look at the next example: Having the data set: 7, 10, 26, 34, 19, 31, 27, 4, 12, 15, a simple stem and leaf plot would look like:
We have 4 different tens in the data set: 10 × 0 = 0, 10 × 1 = 10, 10 × 2 = 20, 10 × 3=30. Now notice the column on the left, or stem, it contains the digits that represent each ten from the data set: 0, 1, 2, 3. On the other side, the right column provides a space for each of the remaining digits for each ten of the data set; in other words, if you have the fourth ten in this case, which is 30, the remaining digits are 1 and 4, because in the data set you have a 31 and a 34. Notice the pattern in the plot, the left column represents the tens, and each digit on the right represents the number to be added to each particular ten to form the values from the data set.
This is a basic stem and leaf plot: tens on the left, single digits on the right, but it is not the only way how one can do stem and leaf plots, you can make these same kind of plots with hundreds, thousands, or even decimals! The options are endless, you are the one to decide which tens (or multiples of ten) go on the stem and then just add the appropriate remaining digits on the leaf.
Look at the next examples:
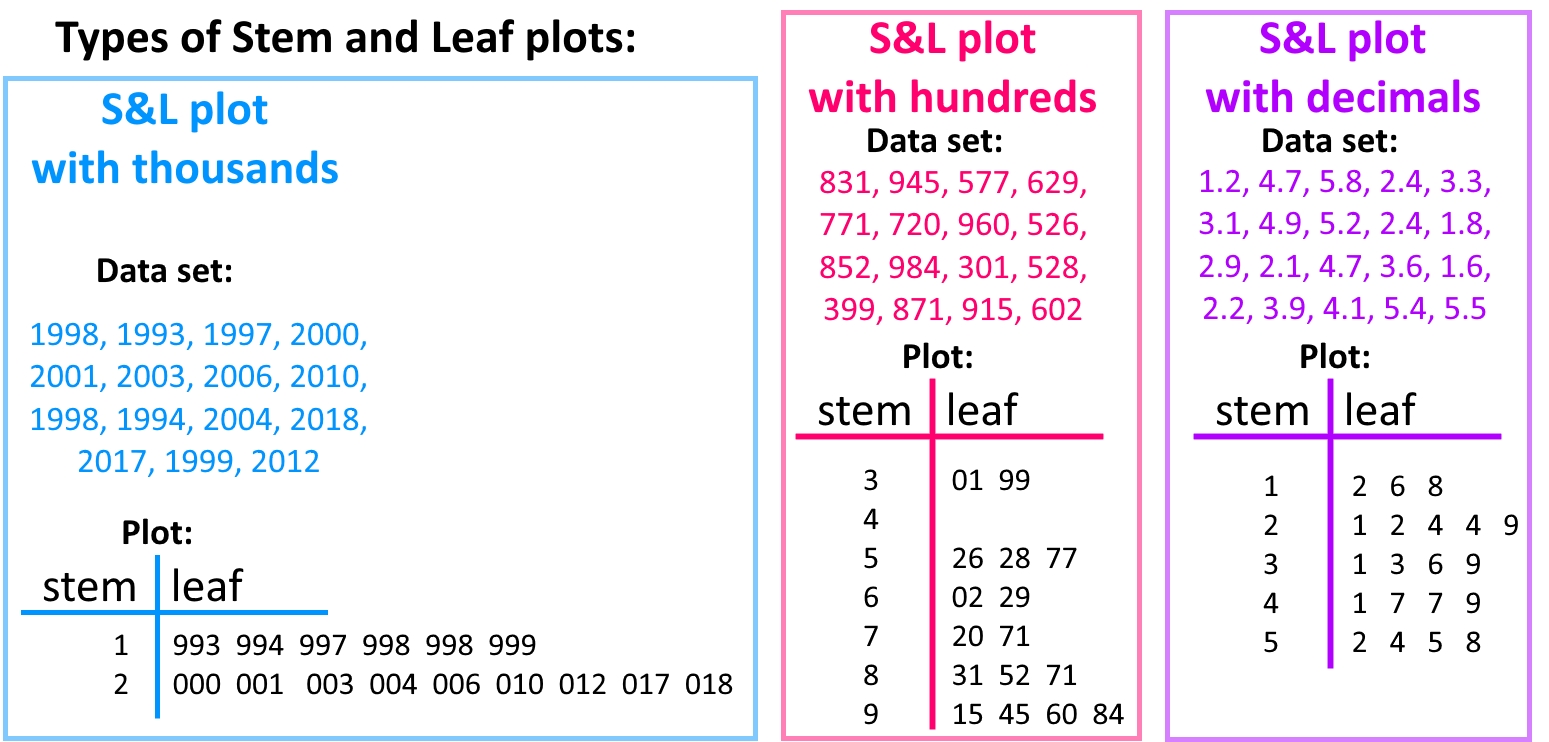
Let us explain each of these examples in figure 2 starting with the plot containing the thousands. Notice on the stem column, you have the tens which in this case they refer to digits that are multiples of 10 in the scale of thousands; therefore, each digit on the stem represents the number multiplied by a thousand: 1 × 1000 = 1000, 2 × 1000 = 2000. Then on the leaf column each set of three numbers are the remaining digits for each value in the data set on one of the two thousands ranges.
This particular plot could be done in several other ways. Remember we said that you could pick the tens (or multiples of ten) you select to be part of your stem, thus, the plot in the scale of thousands has many other options you could pick as the multiples of ten in the stem part; this is one we saw right away:
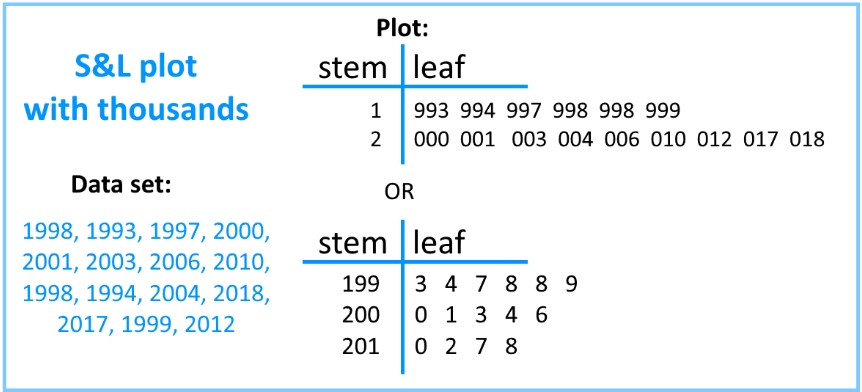
Notice that in the second notation form of the thousands plot, the stems are each of 3 digits. They still represent multiples of 10: 199 × 10 = 1990, 200 × 10 = 2000, 201 × 10 = 2010; therefore, you just need to add the values of the leaf column (or the leaves) to the stems and you will obtain each of the values of the data set. Both notations of this diagram are valid, and so, when constructing a stem and leaf plot with thousands (or with any values) you can choose the way is most convenient to you.
Going back to figure 2, taking a look at the stem and leaf plot with hundreds: each of the values on the stem column represent itself multiplied by a hundred, which added to the leaves produce values of the data set; hence, in this stem and leaf plot the stems are multiples of 10, not tens.
And now the most interesting case: the plot with the decimals. For this case each of the stem values represent themselves exactly how they are (if its a 3, it means 31=3), but, the leaves represent their decimals. For a stem and leaf plot with decimals the line in between the stem and leaf column represents the decimal point.
Now that you know how to read a stem and leaf plot, let us construct one from scratch!
How to construct a stem and leaf plot
Let us learn how to create a stem and leaf plot using the next scenario:
Example 1
Imagine you want to learn the ages of the people who attend the same class of yoga that you attend in the afternoon. After asking all 25 of them, you obtain the following numbers as their ages: 21, 16, 34, 33, 57, 18, 44, 41, 63, 72, 54, 44, 39, 30, 45, 45, 61, 18, 29, 27, 55, 48, 59, 66, 70.We start by ordering the numbers:
16 \(\;\)18 \(\;\) 18 \(\;\) 21 \(\;\) 27 \(\;\) 29 \(\;\) 30 \(\;\) 33 \(\;\) 34 \(\;\) 39 \(\;\) 41 \(\;\) 44 \(\;\) 44 \(\;\) 45 \(\;\) 45 \(\;\) 48 \(\;\) 54 \(\;\) 55 \(\;\) 57 \(\;\) 59 \(\;\) 61 \(\;\) 63 \(\;\) 66 \(\;\) 70\(\;\) 72
Then, we identify the tens that will be part of the stem column (in this case, the first digit of each number), and separate the data values accordingly:

With this in mind, construct the stem and leaf plot by using the first digits of each value as stems and the remaining digits as leaves:
And so, the steps you need to follow in order to make a stem and leaf plot are:
- Order the data values provided from smallest to largest
- Identify the tens or multiples of ten you want to use as stems; remember, these do not need to be a single digit, pick whichever digits are most convenient depending the case.
- Separate all the data values classifying them according to the stem they belong to.
- Build the stem and leaf plot by using the selected stems and writing down as leaves the digits that remain for each data value.
Example 2
A 100m swimming race took place and the time it took the competing swimmers to finish was recorded: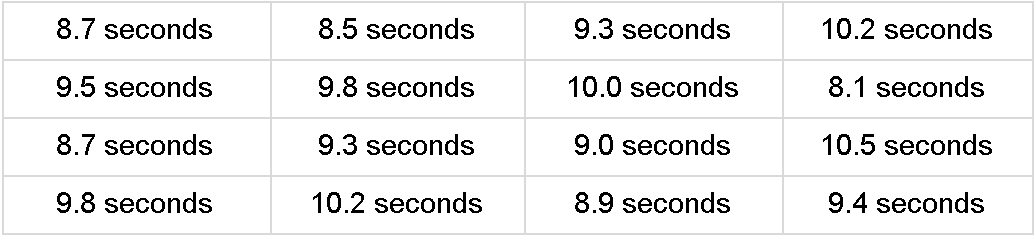
- Create a stem and leaf plot
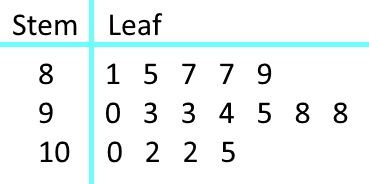
Following the steps we learnt above on how to make a stem and leaf plot, we start by ordering the data values and separating them into categories depending on the stem they belong to:

Building the stem and leaf plot:
Stem and leaf plot advantages
In our past two lessons we talked about the frequency distribution and histograms, and frequency polygons; we learnt these are methods to represent collected data graphically in order for the data to be understood quickly and easily. Although all the options seen on these two lessons (frequency distribution tables, histograms, and frequency polygons) are simple and reliable for this purpose, all of them have a great disadvantage when the class intervals happen to be a range of values rather than an specific outcome: the frequency of an specific outcome value is lost.
Let us exemplify this disadvantage using example 1 from the section above:
So we have the ages of the people in your yoga class, which are: 16, 18, 18, 21, 27, 29, 30, 33, 34, 39, 41, 44, 44, 45, 45, 48, 54, 55, 57, 59, 61, 63, 66, 70, 72.
Next we input the numbers into a frequency distribution table, a histogram and a frequency polygon.
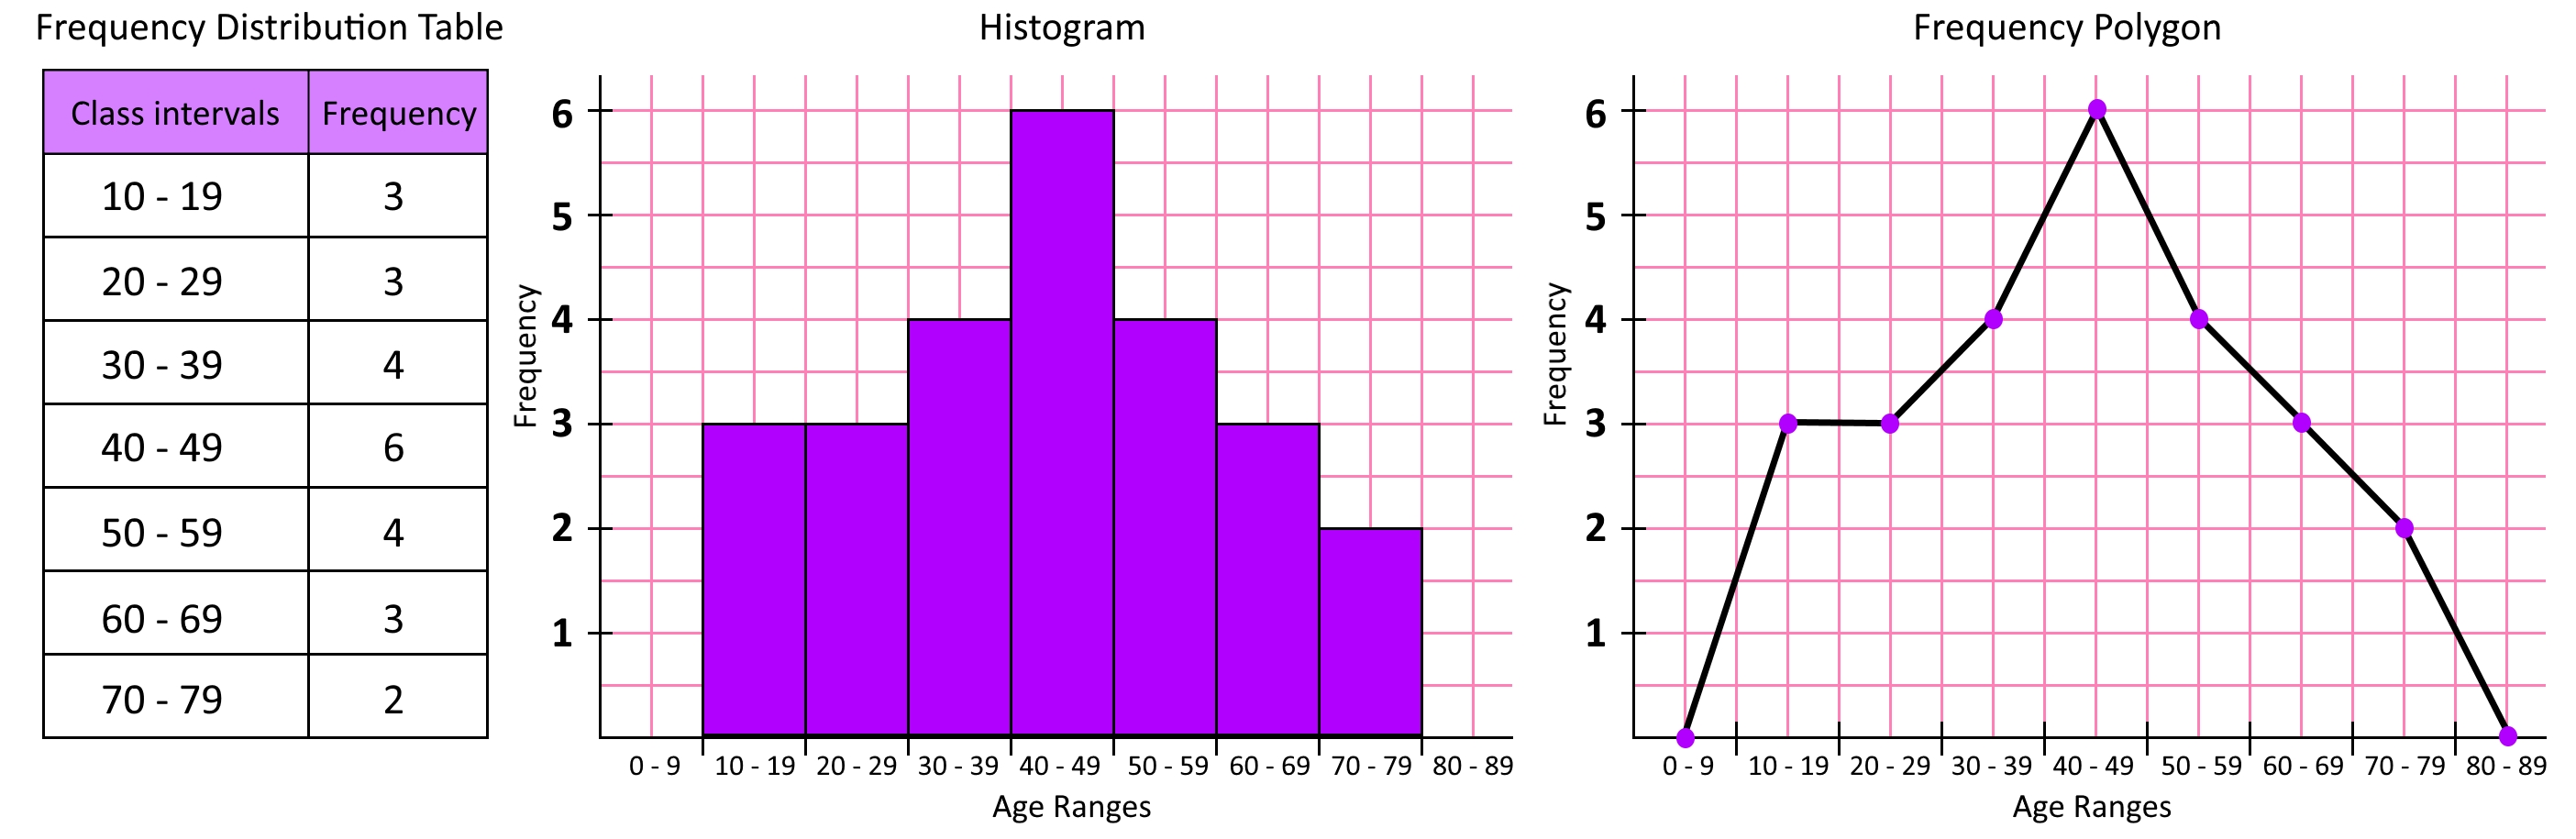
Notice how, although we can see the pattern of the data being displayed in the different ways presented in figure 9, we know about the data by their ranges defined in the class intervals, but we lose sight of each individual data value (our outcome). In other words, we know there are three data values between the range of 10 and 19 years old, but we do not know the specific age; this particular disadvantage can be seen in all three representations in figure 9: we know how many peoples ages are in each range, but we lose the specific value of everyones ages, this does not happen with a stem and leaf plot.
Let us take a look at the stem and leaf plot for example 1 one more time, and now, instead of thinking on it as a table, let us look at it from a graphic perspective:
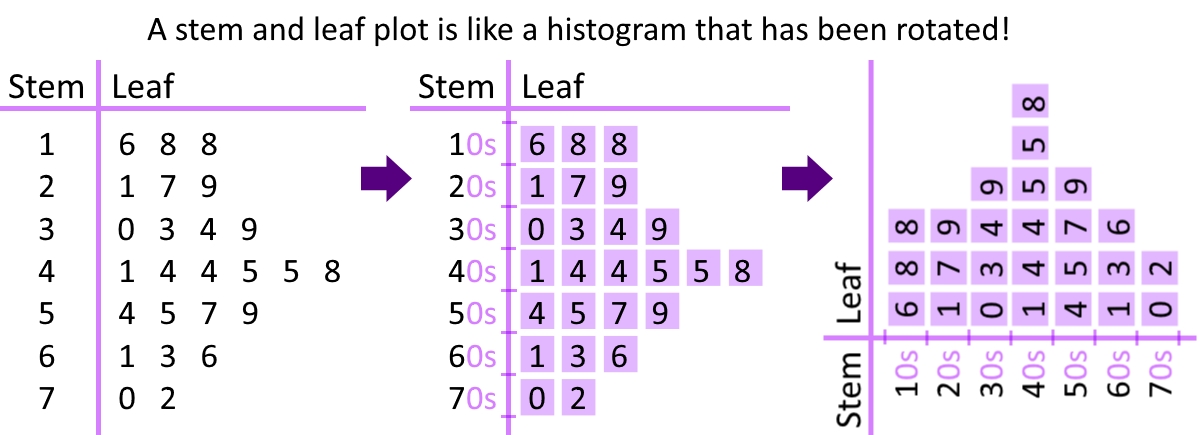
As you can see, the stem and leaf plot could very well serve as a rotated histogram, with the great advantage that you continue to know each individual data value from the plot while is represented in an efficient way.
How to use a stem and leaf plot
On this section we will take a look at a few other stem and leaf plot examples so you can see how we can use these kind of plots in many ways!
Example 3
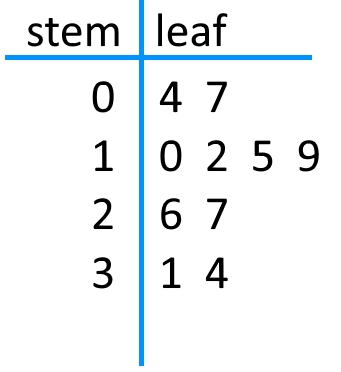
A Stem and Leaf Plot representing the ages of people being immunized against a certain infection.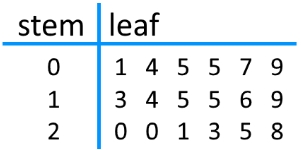
Write out a list of all the numerical data included in the plot:
If we count all of the leaves in the right hand side of the plot, we know there are 18 data values in total, 6 for each range: 0-9, 10-19 and 20-29. So, the data values from smallest to biggest are:
1 \(\; \) 4 \(\; \) 5 \(\; \) 5 \(\; \) 7 \(\; \) 9 \(\; \) 13 \(\; \) 14 \(\; \) 15 \(\; \) 15 \(\; \) 16 \(\; \) 19 \(\; \) 20 \(\; \) 20 \(\; \) 21 \(\; \) 23 \(\; \) 25 \(\; \) 28
Example 4
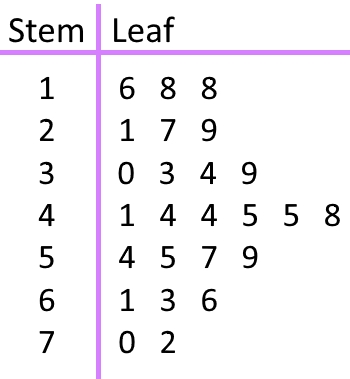
Sandras class brought all their animals into school one day. The weight of each animal was measured and then displayed in the following Stem and Leaf Plot: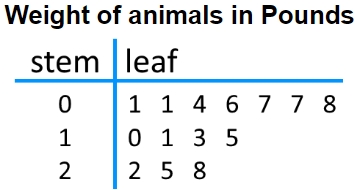
What was the combined weight of every single animal that was taken into school that day?
There are 14 weight values in the plot, adding them all together the result is:
The combined weight is 158 pounds
What was the range of animal weights?
The weight of Sandras animals goes from one pound to 28 pounds.
So the range is largest weight - smallest weight = 28 - 1= 27 pounds
On these last two problem examples we worked on interpreting stem and leaf plots, you can see another interesting example in our last video for this lesson where we introduce what is called the back to back stem and leaf plot (also called a double stem and leaf plot), that video should reinforce what you learned today on how to make a stem and leaf plot and how it can be used.
And so, we are at the end of our lesson for this topic; as always, we have a few link recommendations: On this article you can read more about what are stem and leaf plots used for, and this website showcases how to build a stem and leaf plots step by step. Use these recommendations to supplement your independent studies.
This is it for today, see you in our next lesson!