TOPIC
MY PROGRESS
Pug Score
0%
Getting Started
"Let's build your foundation!"
Study Points
+0
Overview
Watch
Read
Next Steps
Get Started
Get unlimited access to all videos, practice problems, and study tools.
BACK TO MENU
Topic Progress
Pug Score
0%
Getting Started
"Let's build your foundation!"
Videos Watched
0/0
Read
Not viewed
Study Points
+0
Overview
Watch
Read
Next Steps
Watch
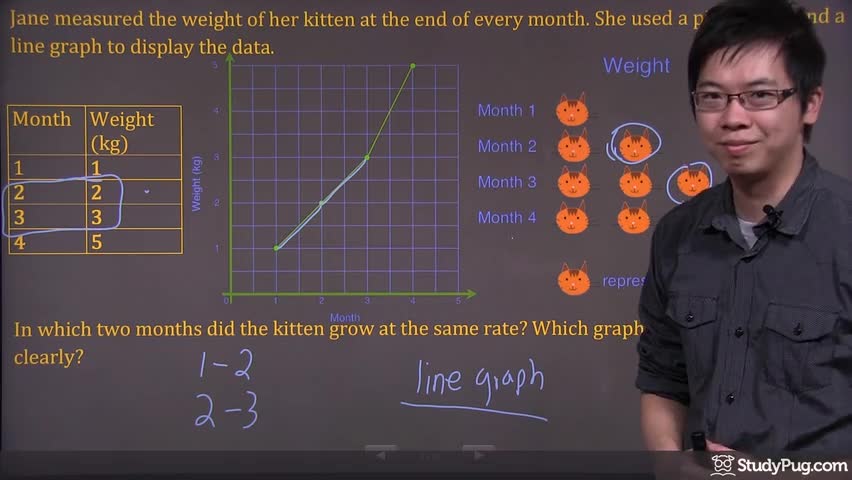
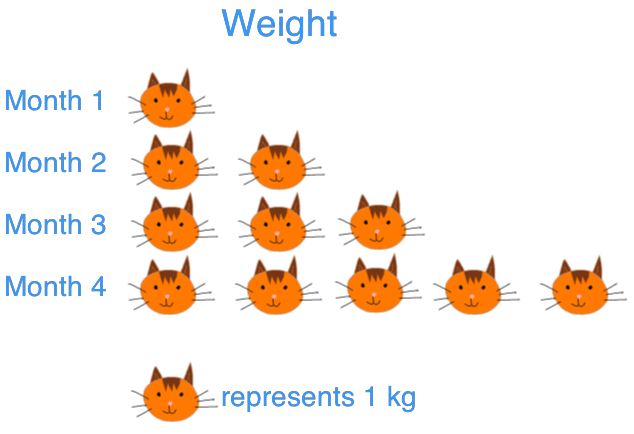
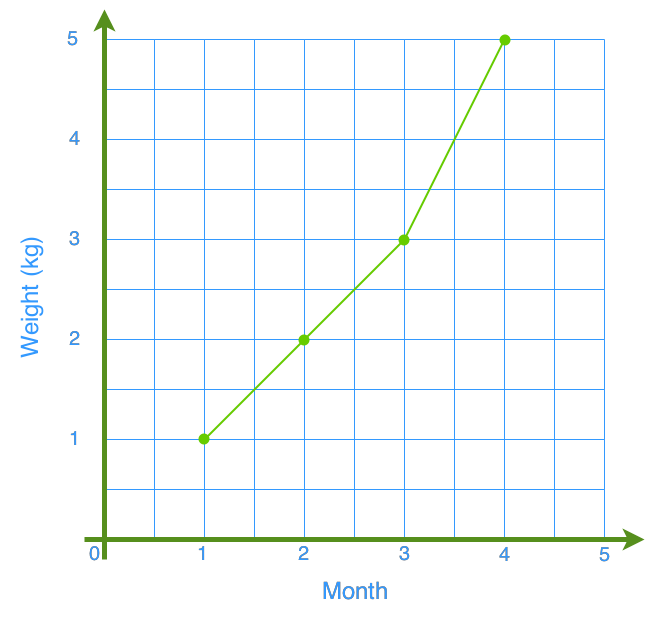
Comparing kitten growth rates using a line graph and pictograph
📝 My Notes
Auto-saves the current timestamp
Comparing kitten growth rates using a line graph and pictograph
3:08
About this lesson
|
Month |
1 |
2 |
3 |
4 |
|
Weight (kg) |
1 |
2 |
3 |
5 |
Key Moments
No key moments available.
Video 1 of 7
Comparing kitten growth rates using a line graph and pictograph
3 min
• Selected
Comparing advantages and disadvantages of line graphs vs pictographs
2 min
Comparing advantages and disadvantages of line graphs vs pictographs
2 min
Drawing a double bar graph and double line graph for temperature data
5 min
Comparing temperature trends between two cities using a double line graph
2 min
Comparing double bar graph vs double line graph for temperature data
2 min
Why circle graphs fail for monthly temperature data
2 min