

In a world obsessed with possessing the latest and greatest things in life, the drive to either make it or break in such a pursuit is often fuelled by the desire to be trendy. Whether this is the case of the physical or the material, this idea has engulfed almost all areas of our life, particularly through the form of social media and the Internet.
Think about the last time you were on Facebook – immediately right on the home page you were faced with news/stories that were trending. Or the last time you went to discover fellow instagrammers around you: instant bombarded with pictures that were gaining traction in the “likes” department, they were trending. How about the last time you went to look something up on twitter and observed the proverbial trending “hashtags” (otherwise known by generation X as a pound sign or a number sign) that provided you information on what was happening presently? Social media platforms such as YouTube have a designated “Trending” page that features viral videos that are mustering millions of views and shares at incredible rates (although content is also considered, see here). Even today on paper, what you see on the front page and headlines of news articles are products of trends. Straying closer to home and your inner circles you may have noticed trends/what was trending simply by observing the majority fashion sense, dishes restaurants have been featuring, or even the latest sell from grocery stores as the new “superfood”.

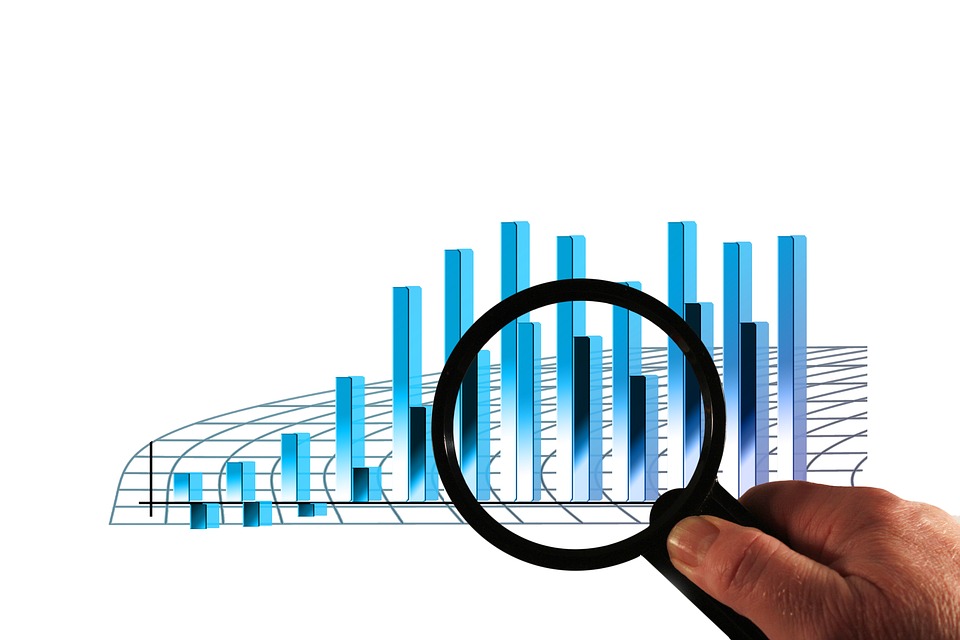
Digital Marketing Trends image. Picture Credits: Automotive Social
So how do we define trends? Or what makes up the premise of what will be trending? At the very core of all trends is the increase in popularity and attention garnered from us consumers. Be it in the form of a movement (e.g. Black Lives Matter, MeToo), an item (e.g. fidget spinners), a human (e.g. President Trump), or a major event (e.g. death of King Bhumibol Adulyadej, the rising value of Bitcoin), our attention determines what rises or falls from the front pages of our news outlets, or the screens from our mobile devices. Some trends are more predictable such as the release of StarWars: The Last Jedi, Taylor Swift’s new music video, or the coronation of Queen Elizabeth. These hot topics makes selling the news easy and easily draws mass followings.

Collage of popular trends: Taylor Swift, King Bhumibol Adulyadej, Bitcoin, StarWars, Black Lives Matter. Photo credits: Eva Rinaldi, John Dominis, Simon, Rakruthof, and Johnny Silvercloud.
But how is all this attention calculated and assessed in order to place something/somebody on the front lines? Well the truth is not much information is released on how these numbers are populated, analysed, and interpreted. How are these data points being analysed constantly on the fly to feed our burning desires to be relevant, have what is best, be hip, and be up to date on the most interesting news? What are the statistics on these trends and how have they changed over time? Companies like Google, Twitter and YouTube, attempt to at being transparent (see Twitter’s trending policy, see YouTube’s trending policies). But for the most part we are left to mull over the secret contents of some algorithm that does a myriad of complicated things to ensure fairness, and the promotion of “appropriate” content. Truth being told, it appears that what we feed ourselves, how we dress, and stay in the trendy spotlight day in and day out is trusted by and determined by a mysterious algorithm.
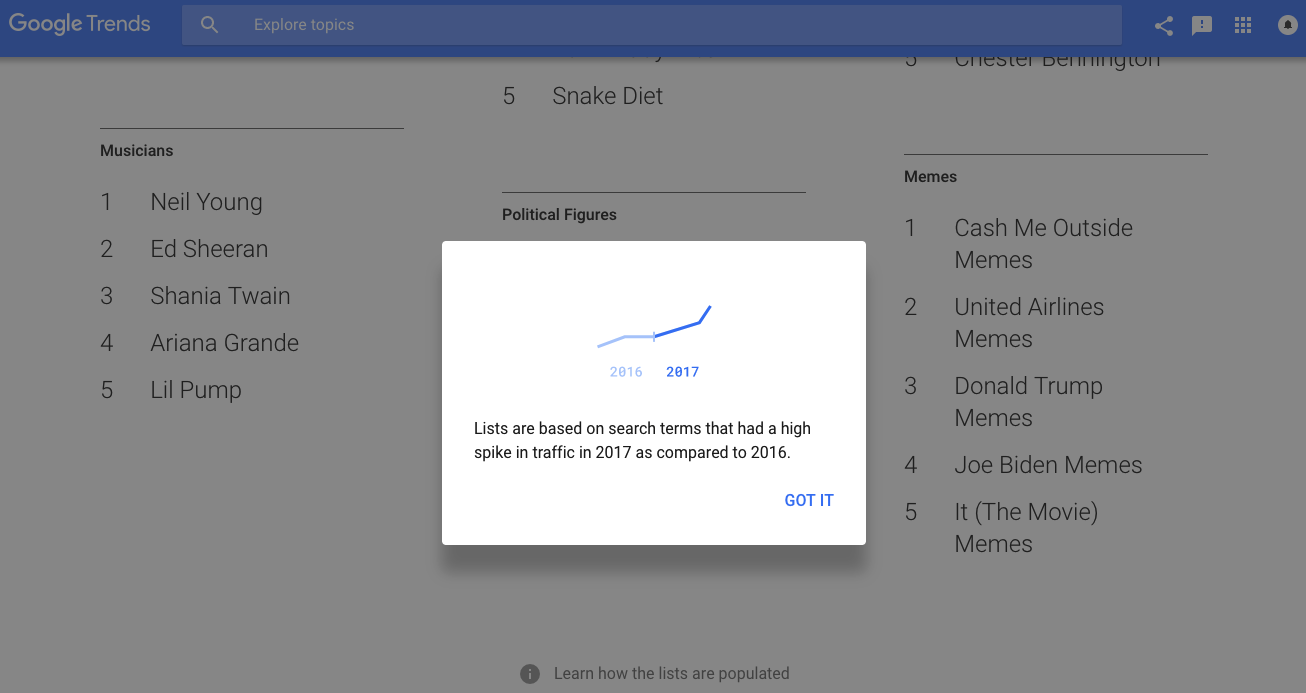
A quick survey of 2017 Google trends indicate that trends are determined by comparison of the “traffic” for that search time in 2016 versus 2017. What would be particularly interesting is to determine whether these differences are statistically significant or what data sampling methods were used or perhaps have a closer look at other factors such as demographics of the statistics.
So without the raw data can we believe these trends? Where are the raw data and numbers? While not particularly worrying in this scenario of fashion or possession, what may be more frightening is when trends and statistics are construed in the context of political platitudes and gross news statements. Such trending items are certainly harder to police via an algorithm when the person of interest is as notable as the president of the U.S.A. In 2017, Twitter received serious backlash for the trending tweets of President Trump that featured graphic anti-muslim videos, initially in the interest of “newsworthy for public interest”, although later quickly refuting to current media policy.
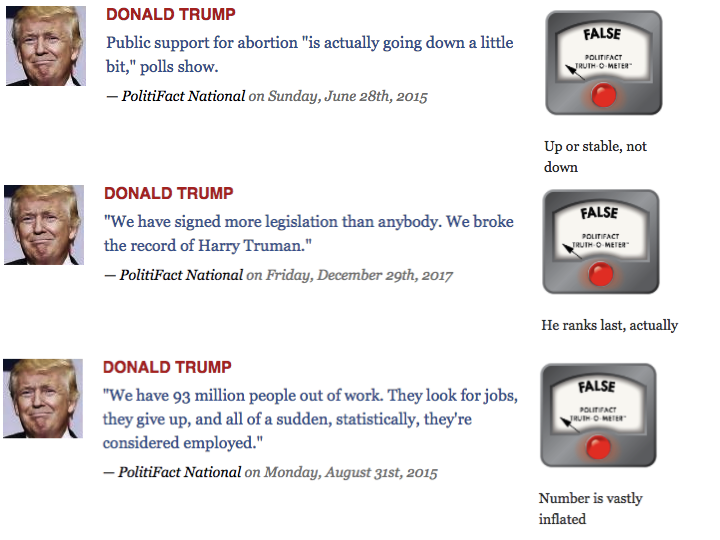
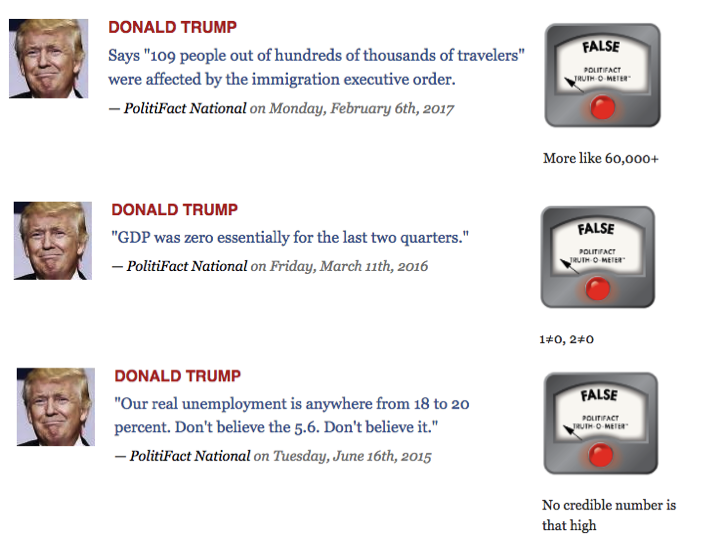
Trump has also been notorious for failing to report truthfully, and yet because of his current position of power, “trends”, and receives the attention, arguably by many unwanted attention. Observe a few of these sweeping statistical statements made by Trump, curated and policed by PolitiFact:
It is worth pointing out that several news outlets, celebrities, and even ordinary people are guilty of reporting inaccurately. Sometimes the error is simply a report out of context that is misused, however, more often that not, the statistic is made-up and blatantly misappropriated.
So how do we protect ourselves in a world of bad statistics? As much as there is a desire and tendency to draw towards what’s trending, we need to be aware of what we are bringing attention to and how to fight against the lies that we may be regurgitating to others.
Here are 4 tips on how you can avoid the pitfalls of a trending false statistic:
- Understand that correlation does not equate to causation
A common error observed in academia but equally in the real world is relating correlation to causation. A headline that may turn heads for example is one that suggests that if you make more money, you will have more sex, as seen in “More Buck For Your Bang: People Who Have More Sex Make The Most Money”. While incredibly attractive, when considering the rule of correlation ≠causation, reality kicks in and you begin to recollect that there are certainly more complex factors to consider as compared to simply making a wad of cash to also expect a proportional increase to your levels of sexual activity.
Another example of this common misconception that you may encounter goes along these lines “Ever since the approval of recreational use and sales of marijuana in the province of British Columbia, the rates of robbery have decreased significantly”. While there are undoubtedly many connotations that link drug use and instances of crime, these two statistical trends are not necessarily a case of A causing B: They should be simply viewed as correlations.

Weed ad promoting legalization.
- Always ask for definitions
This is an easy loophole for statistics and trending news when put on the spot for: A simple change in the definition allows the person/topic of interest, or statistic, to escape accountability and remain relevant. However not many consumers will stop to question definitions and assume that the norm is to be taken at face value.
For example, one could claim that today the number of students dropping out from school is at an all time high of 88%. Such a high percentage easily draws alarming attention but two initial definitions we ought to ask for are “school” and “dropping out”. School could indicate primary, secondary, or high school. Secondly, dropping out suggests a student no longer returns to school or any form of education. So more questions ought to be asked if these “dropouts” are individuals that have matured and are no longer seeking education or if they temporarily stopped attending school for a certain period of time. Without definite definitions, statistics can be skewed and misleading in serious way.
- Look for raw data and data sampling methods

Raw data and data sampling methods can be hard to find, particularly in the context of a tweet, a speech, or even a news column. While there are certainly concerns regarding the fair use and protection of personal and public data, technological advancements have now made it possible to protect and accredit data that is shared so that transparency is maintained. Sampling methods are also critical because it provides the big picture and context of the statistical results. Using the appropriate sampling methods is also important to achieve results that are pertinent to the question/statistical test. All in all statistics and trends may sound false alarms if not investigated further. For example, a claim that only 3% of people are satisfied with the increase in minimum wages ought to be taken with a grain of salt if results were obtained from a small survey of 150 individuals completed in a single day in the small town of Stevenson where the economically active population is as low as 5%.
- What are the margins of error?
As with all things regarding numbers, math, and statistics, there are margins of error. A survey is never truly perfect; a statistic is never fully accurate. Large margins of error can prove to indicate that a trend, statistic, cannot be trusted or is in fact stagnant. So the next time you hear that the number of petty crimes has decreased by 20,000 incidents per month, with a margin of error of +/- 40,000, do not buy into this. On the flipside, perhaps you hear that price of gas has dropped by $2 dollars, given a margin of error of +/- $0.50 cents. For this case, we highly suggest you buy right away!
Armed with these tips, increase your vigilance and do your own policing – Be sure to read between the lines, follow trends cautiously and weed out those #badstats!