Solving linear equations by graphing
All in One PlaceEverything you need for better grades in university, high school and elementary. | Learn with EaseMade in Canada with help for all provincial curriculums, so you can study in confidence. | Instant and Unlimited HelpGet the best tips, walkthroughs, and practice questions. |
Make math click 🤔 and get better grades! 💯Join for Free
Intros
Examples
Lessons
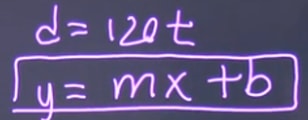
- A train travels at a speed of 120km/h. The equation that represents the relationship of distance (d) and time (t) is d=120t.
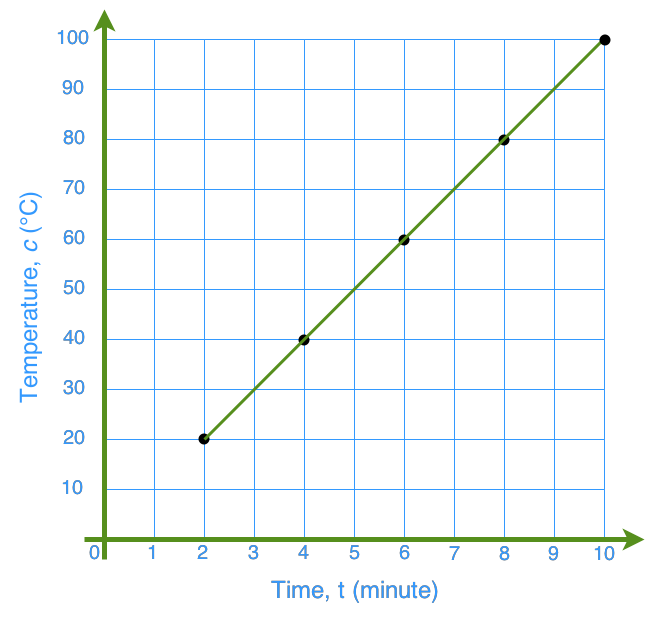
- The graph shows the relationship of the temperature of water, c, and time, t, as the water boils.
- Plot the graph for each set of values. Then, find the equation that represents each relationship.
- Mark ran a marathon. Below is the record of how he did.
Time, t (h)
Distance, d (km)
0.5
4.2
0.8
6.7
1.3
10.9
2.9
24.4
3.5
29.4
4.2
35.3


Topic Notes
How to solve an equation by graphing
A linear equation gives us a straight line when we graph out the points on it. They have a linear relationship. So how do we go about solving an equation by graphing? In this lesson, we'll specifically be focusing on linear equations.
How to graph linear equations
The first thing you'll have to do in order to graph a linear equation is to put the equation into the slope intercept form. When writing linear equations, you can write it a variety of ways. The slope intercept form looks like this:
You may need to rearrange some of the terms around to help you isolate y to the left side of the equation before you can get it to look like the slope intercept form equation. Once you are done this, you can move on to step 2.
For this second step, plot out the y-intercept of the equation. Find out what y's coordinate is when x is equalled to 0. This will give you the y-intercept. At times, you may find that your equation doesn't give you a y-intercept (which is times when there is no "b" in your slope intercept form equation). In that case, your first point will be at 0,0 instead of at the y-intercept.
Thirdly, we'll find the second point that we'll be noting down. This will be found through the slope. When you have an equation in the form of a slope-intercept form, the "m" is your slope. The slope m is equalled to rise/run: the rise is how far it goes on the y-axis and the run is how far it goes on the x-axis. Using this knowledge, let it help you find where the second point is based off your first point. So for example, in step 2, if you found that a point was at (0, -2) and your "m" was 1, then your is equalled to . This means you'd move 1 point up on the y-axis, and 1 point to the right on the x-axis. You'll end up with the second point being at (1,-1).
For the fourth and last step, all you'll have to do is draw a line between the two points you've found from the above steps. Make sure that your graph is point the right way depending on if the slope is positive, negative, 0 or undefined.
Example problems
It's time to put the steps we just learned into use and see how to graph equations. Here are some example problems for you to walk through.
Question 1:
A train travels at a speed of 120km/h. The equation that represents the relationship of distance (d) and time (t) is d=120t.
Plot the equation on a graph
Solution:
The equation in this question is d=120t, which resembles y=mx+b. This means our equation is in slope intercept form.
So, draw the x and y axis
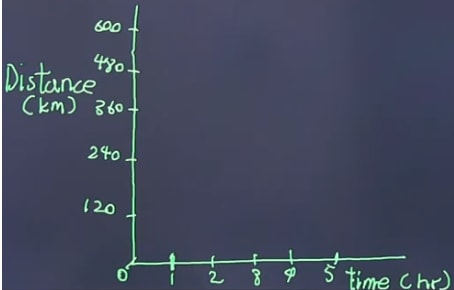
120 is the slope. Slope
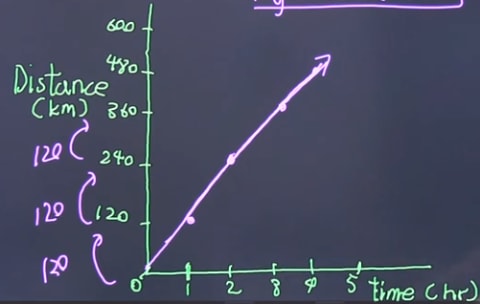
Since it is 120km/hour, it means the train moves 120km every hour. So the graph will look like this
Question 2:
A train travels at a speed of 120km/h. The equation that represents the relationship of distance (d) and time (t) is d=120t.
Calculate the distance that the train travels in 4.5 hours.
Solution:
Plug the number into the equation
d = 120t
d = 120(4.5)
= 540 km
Question 3:
The graph shows the relationship of the temperature of water, c, and time, t, as the water boils.
What is the equation for the relationship?
Solution:
Try to write the equation in slope intercept form y = mx + b
So, look for the slope from the graph:
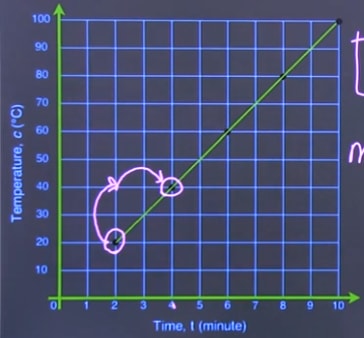
m = slope =
So the equation is: c = 10t
Question 4:
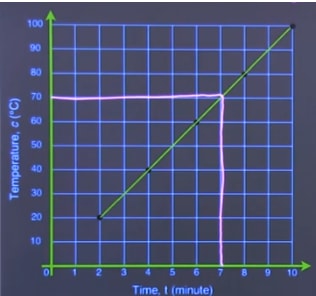
The graph shows the relationship of the temperature of water, c, and time, t, as the water boils.
Find the temperature of the water after 7 minutes of boiling.
Solution:
From the graph, we know that at 7 minutes the temperature is 70°
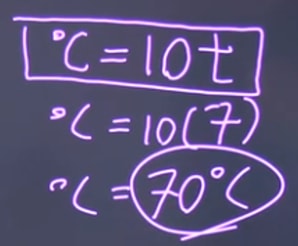
We can also get the answer algebraically
c = 10t
c = 10(t)
c = 70°C
Question 5
Plot the graph for each set of values. Then, find the equation that represents each relationship.
|
x |
Y |
|
-2 |
-3 |
|
-1 |
0 |
|
0 |
3 |
|
1 |
6 |
|
2 |
9 |
Solution:
Draw the appropriate x and y axis from the above table of values. This is a method to graphing linear equations.
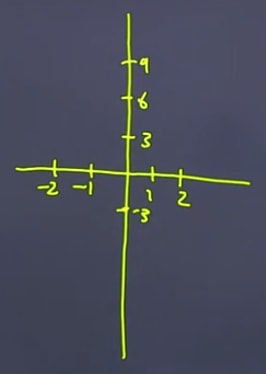
Plot the point based on the table, and draw the line
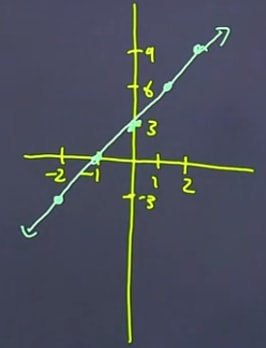
Now, let's determine the equation.
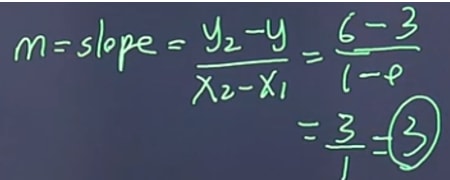
It will be in this form: y = mx + b. We need to know the "m" and the "b", where m = slope. To find this we can calculate using the slope equation .
slope =
For "b", it is actually the y-intercept. From the graph, we know the y intercept = 3. Also, we can find the "b" by looking at the table of values because the x value of the coordinate of the y-intercept is always = 0. We can look at the table of values for x = 0, which gives us y = 3.
So the equation: y = 3x + 3
If you wanted to look more into graphing lines check out this online interactive simulation that touches on slope intercept form equations.
To further solidify your understanding of this lesson, check out these lessons on general linear function slope equations, the slope point form linear equations, and how to graph linear functions using a table of values. Then try out some word problems dealing with graphing linear functions.