TOPIC
MY PROGRESS
Pug Score
0%
Best Streak
0 in a row
Study Points
+0
Overview
Practice
Watch
Read
Quiz
Next Steps
Get Started
Get unlimited access to all videos, practice problems, and study tools.
Back to Menu
Topic Progress
Pug Score
0%
Videos Watched
0/0
Best Practice
No score
Read
Not viewed
Best Quiz
No attempts
Best Streak
0 in a row
Study Points
+0
Overview
Practice
Watch
Read
Quiz
Next Steps
Read
Infinite Limits and Vertical Asymptotes
Limits don't always necessarily give numerical solutions. What happens if we take the limit of a function near its vertical asymptotes? We will answer this question in this section, as well as exploring the idea of infinite limits using one-sided limits and two-sided limits.
In this outline, we explored the concept of infinite limits and their graphical representation through vertical asymptotes. Understanding infinite limits is crucial in calculus and real-world applications, as it helps us analyze the behavior of functions as they approach certain values. The introduction video provided a solid foundation for grasping these concepts, and we encourage you to revisit it if needed. Additionally, we recommend exploring the further resources available to deepen your understanding and gain more practice with infinite limits and asymptotes. Mastering these topics will not only enhance your mathematical skills but also prepare you for more advanced concepts in calculus and related fields.
Example:
Determine Infinite Limits Graphically
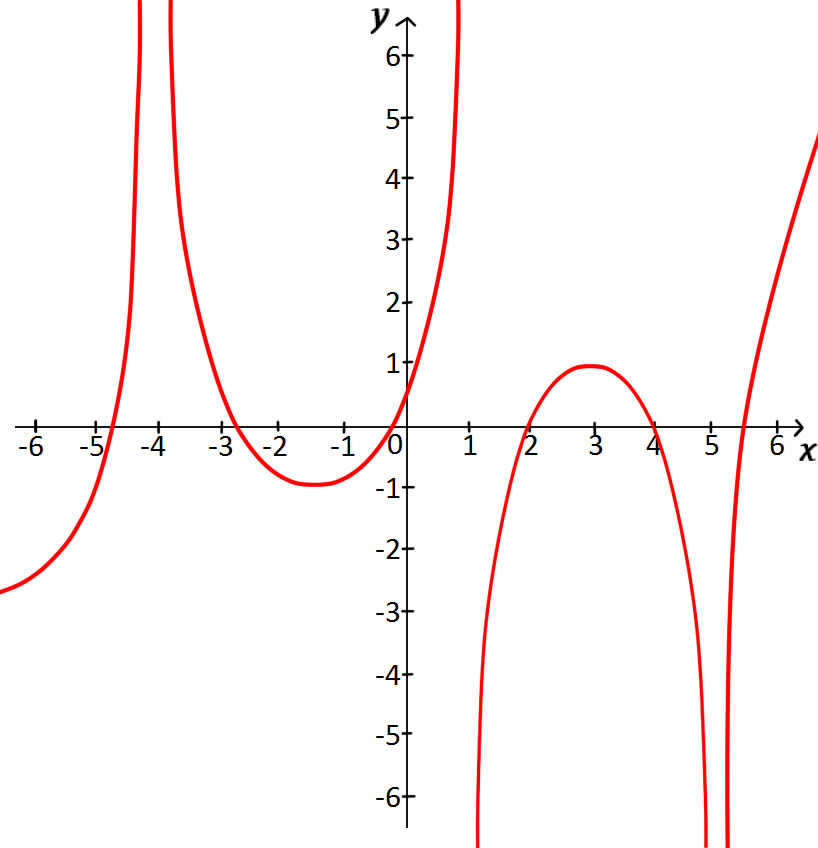
For the function \(f\) whose graph is shown, state the following:
\(\lim_{x \to - {4^ - }} \;f\left( x \right)\)
\(\lim_{x \to - {4^ + }} \;f\left( x \right)\)
\(\lim_{x \to - 4} \;f\left( x \right)\)
Step 1: Understanding the Problem
In this question, we are tasked with finding the limit of a function from the graph provided. The limits we need to determine are as \(x\) approaches -4 from the left, from the right, and from both directions. This involves understanding the behavior of the function near the point \(x = -4\).
Step 2: Finding the Left-Hand Limit
First, we need to find the limit of the function as \(x\) approaches -4 from the left, denoted as \(\lim_{x \to -4^-} f(x)\). To do this, observe the graph as \(x\) gets closer to -4 from values less than -4. Notice how the function behaves as it approaches this point. From the graph, we can see that as \(x\) approaches -4 from the left, the value of the function increases without bound in the positive direction. Therefore, the left-hand limit is positive infinity.
Step 3: Identifying Vertical Asymptotes
Whenever we encounter an infinite limit as \(x\) approaches a certain number, it indicates the presence of a vertical asymptote at that number. In this case, since the limit as \(x\) approaches -4 from the left is positive infinity, we should expect a vertical asymptote at \(x = -4\). This means the function has a vertical line at \(x = -4\) where the function values increase without bound.
Step 4: Finding the Right-Hand Limit
Next, we need to find the limit of the function as \(x\) approaches -4 from the right, denoted as \(\lim_{x \to -4^+} f(x)\). To do this, observe the graph as \(x\) gets closer to -4 from values greater than -4. From the graph, we can see that as \(x\) approaches -4 from the right, the value of the function also increases without bound in the positive direction. Therefore, the right-hand limit is positive infinity.
Step 5: Determining the Two-Sided Limit
Finally, we need to find the limit of the function as \(x\) approaches -4 from both directions, denoted as \(\lim_{x \to -4} f(x)\). If the direction is not specified, we must consider approaching the number from both the left and the right. The two-sided limit exists only if the left-hand limit is equal to the right-hand limit. In this case, both the left-hand limit and the right-hand limit are positive infinity. Therefore, the two-sided limit exists and is equal to positive infinity.
FAQs
-
What is the difference between one-sided limits and two-sided limits?
One-sided limits, also known as left and right limits, describe the behavior of a function as it approaches a specific point from either the left or right side of the domain. The left limit represents the limit as the input values approach the point from the left, while the right limit represents the limit as the input values approach the point from the right. Two-sided limits, on the other hand, consider the behavior of the function as it approaches the point from both sides simultaneously.
-
How do vertical asymptotes relate to infinite limits?
Vertical asymptotes and infinite limits are closely related concepts. A vertical asymptote occurs when a function approaches positive or negative infinity as the input variable approaches a certain value. This behavior is represented by an infinite limit, where the function's values become unbounded or approach infinity at that point. Graphically, vertical asymptotes manifest as vertical lines on the graph, indicating regions where the function's values become infinite.
-
What are the techniques for evaluating infinite limits?
There are two main techniques for evaluating infinite limits: numerical analysis and algebraic methods. Numerical analysis involves using computational methods to approximate the value of a limit as the input approaches a specific value, while algebraic methods involve manipulating the algebraic expression of the function to determine its behavior as it approaches infinity. Algebraic methods often rely on techniques such as factoring, rationalizing, and applying various limit laws and theorems.
-
What is the significance of curve sketching for rational functions?
Curve sketching is particularly important for rational functions due to the presence of vertical asymptotes and potential domain restrictions. Identifying vertical asymptotes, holes, and asymptotic behavior is crucial for understanding the overall shape and behavior of the graph. Curve sketching for rational functions involves finding the domain, identifying vertical asymptotes, locating x-intercepts, and determining the asymptotic behavior as x approaches positive and negative infinity.
-
How do you determine the presence of a vertical asymptote in a rational function?
A vertical asymptote occurs in a rational function when the denominator is equal to zero, and the numerator is non-zero. To determine the presence of a vertical asymptote, you need to set the denominator equal to zero and solve for x. The resulting x values represent the locations of the vertical asymptotes.
Prerequisite Topics
Understanding the concept of "Infinite limits - vertical asymptotes" requires a solid foundation in several prerequisite topics. Mastering polynomial functions is crucial because vertical asymptotes often arise from rational functions, which are formed by dividing polynomials. Additionally, rational functions play a significant role in determining the behavior of functions near vertical asymptotes.
Curve sketching techniques are essential for visualizing the behavior of functions, including their asymptotic behavior. By understanding how to sketch curves, students can better grasp the concept of vertical asymptotes and their impact on the graph of a function. Furthermore, limit laws provide the mathematical tools necessary to evaluate limits and determine the existence of vertical asymptotes.
Mastering these prerequisite topics will not only enhance your understanding of infinite limits and vertical asymptotes but also lay a solid foundation for more advanced calculus concepts. By building a strong grasp of polynomial functions, rational functions, curve sketching, and limit laws, you will be better equipped to tackle the intricacies of vertical asymptotes and their implications in calculus and beyond.