Showing patterns in T-tables
Topic Notes
In this lesson, we will learn:
- T-table are tools for keeping track of patterns and can help you predict the next terms in the pattern
- There are growing patterns and shrinking patterns involving figures and blocks/line segments/shapes or more realistic problems involving time and money
Notes:
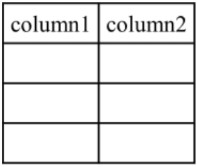
- A T-table is a table with 2 columns (or more) that keeps track of patterns.
- A T-table is a table with 2 columns (or more) that keeps track of patterns.
- The second column (right) keeps track of the number of things being counted (ex. blocks, line segments, dollars, etc.)
- The two types of patterns you will see in T-tables are:
- growing patterns where the numbers in the pattern are getting bigger (increasing) in each successive line of the T-table
- shrinking patterns where the numbers in the pattern are getting smaller (decreasing) in each successive line of the T-table
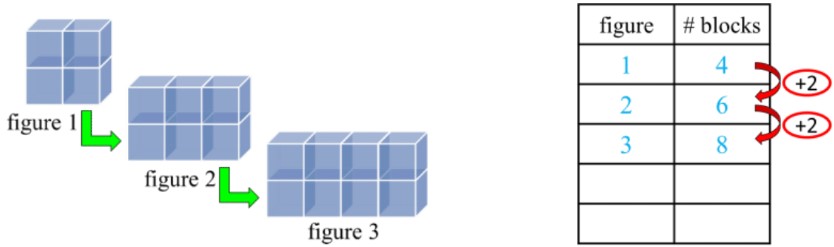
Example: a growing pattern with blocks starts with a 4-block figure and adds 2 each time to make the next figure has a T-table filled out like this:
- T-tables allow you to predict and calculate the next terms in the pattern
- Using the previous block example, you can continue the pattern even if you dont have pictures of the next figures (4th and 5th figures):
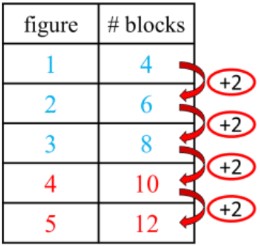
- The same idea will apply for a shrinking pattern, but the relationship between each row will be subtracting an amount instead of adding.
Introduction to T-Tables and Patterns
Welcome to the fascinating world of T-tables! These simple yet powerful tools are essential for understanding and visualizing patterns in mathematics. T-tables, named for their T-shaped structure, help us organize information and spot relationships between numbers or variables. They're particularly useful in algebra, where we often need to track how one value changes in relation to another. Our introduction video provides a clear, step-by-step guide on how to create and use T-tables effectively. By watching this video, you'll gain a solid foundation in working with T-tables and recognizing patterns. This skill is crucial for solving equations with T-tables, graphing functions with T-tables, and even tackling real-world problems. As we explore T-tables together, you'll see how they make complex concepts more accessible and help you develop a deeper understanding of mathematical relationships between numbers. So, let's dive in and discover how T-tables can unlock the patterns hidden in numbers!
Understanding T-Tables and Their Structure
T-tables are a versatile and visual tool used in mathematics to represent relationships between numbers or sets of data. As the name suggests, these tables resemble the letter 'T' in their structure, which makes them easily recognizable and memorable. Let's dive into what T-tables are, how they're structured, and why they're so useful in mathematical thinking.
The structure of a T-table is simple yet effective. It consists of two columns, typically separated by a vertical line, with a horizontal line at the top that extends across both columns. This creates the distinctive 'T' shape that gives these tables their name. The left column usually represents one set of values or variables, while the right column shows the corresponding values or results.
One of the primary purposes of T-tables is to illustrate relationships between numbers or data sets. For example, they can be used to show input and output values in a function, compare two different quantities, or display patterns in number sequences. This visual representation makes it easier for students and professionals alike to spot trends, patterns, or correlations that might not be immediately apparent in a list of numbers.
Let's look at a few examples to better understand how T-tables work. Imagine we want to show the relationship between consecutive numbers and their squares. Our T-table might look like this:
Number | Square
1 | 1
2 | 4
3 | 9
4 | 16
5 | 25
In this T-table, the left column shows consecutive numbers from 1 to 5, while the right column displays their squares. This visual representation makes it easy to see how quickly the squares grow compared to the original numbers.
Another common use of T-tables is in algebra, where they can help solve equations or illustrate function relationships. For instance, we could use a T-table to show values of y = 2x + 1:
x | y
0 | 1
1 | 3
2 | 5
3 | 7
4 | 9
This T-table clearly shows how y changes as x increases, making it easier to understand the linear relationship between the two variables.
T-tables are not limited to just numbers; they can also be used to organize and compare qualitative data. For example, in language learning, a T-table might be used to compare similar words in two languages:
English | Spanish
Hello | Hola
Goodbye | Adiós
Please | Por favor
Thank you | Gracias
The beauty of T-tables lies in their simplicity and flexibility. They can be easily drawn by hand or created digitally, making them accessible tools for students, teachers, and professionals across various fields. Whether you're studying mathematics, analyzing data, or learning a new language, T-tables offer a clear and organized way to present information and explore patterns in number sequences.
In conclusion, T-tables are powerful tools for visualizing and understanding relationships between numbers, variables, or concepts. Their distinctive 'T' shape, with two columns separated by vertical and horizontal lines, provides a simple yet effective structure for organizing information. By using T-tables, we can more easily identify patterns, make comparisons, and gain insights into various mathematical and non-mathematical relationships. Whether you're a student tackling algebra problems or a professional analyzing data trends, mastering the use of T-tables can significantly enhance your ability to process and present information clearly and effectively.
Growing Patterns in T-Tables
Growing patterns are fascinating sequences that follow a specific rule, increasing in a predictable way. Let's explore how to identify and predict these patterns using T-tables, blocks, and line segments. Understanding growing patterns is not only fun but also helps develop critical thinking and problem-solving skills.
Using Blocks to Visualize Growing Patterns
Imagine we have a pattern that starts with one block in the first step, then three blocks in the second step, and five blocks in the third step. We can represent this in a T-table:
| Step | Number of Blocks |
|---|---|
| 1 | 1 |
| 2 | 3 |
| 3 | 5 |
To identify the pattern, look at how the number of blocks changes from one step to the next. In this case, we're adding 2 blocks each time. This is our growing rule!
Predicting the Next Terms
Now that we've identified the pattern, let's predict the next terms:
- Step 4: 5 + 2 = 7 blocks
- Step 5: 7 + 2 = 9 blocks
We can continue this pattern as far as we need. The key is to apply the growing rule consistently.
Line Segments and Growing Patterns
Line segments offer another great way to visualize growing patterns. Let's look at a pattern where we start with one line segment and add two segments each step:
    Step 1: |
    Step 2: | | |
    Step 3: | | | | |
In a T-table, this would look like:
| Step | Number of Line Segments |
|---|---|
| 1 | 1 |
| 2 | 3 |
| 3 | 5 |
Notice how this pattern is similar to our block example? The rule is the same: add 2 each time.
Steps to Identify and Predict Growing Patterns
- Observe the first few terms of the pattern.
- Look for the difference between consecutive terms.
- Check if this difference is consistent.
- Apply the rule to predict the next terms.
- Verify your predictions by extending the pattern.
More Complex Growing Patterns
As you become more comfortable with simple growing patterns, you can explore more complex ones. For example, consider a pattern that doubles each time:
| Step | Number |
|---|---|
| 1 | 2 |
| 2 | 4 |
| 3 | 8 |
Here, instead of adding a fixed amount, we're multiplying by 2 each step. To predict the next term, we'd multiply 8 by 2, giving us 16 for step 4.
Encouraging Pattern Exploration
Remember, exploring growing patterns can be exciting! Don't be afraid to make mistakes they're part of the learning process. Try creating your own patterns with blocks, draw them with line segments, or even use everyday objects. The more you practice, the better you'll become at spotting patterns.
Realistic Problems Using T-Tables
Let's dive into some real-world problems involving money and time that we can solve using T-tables. These handy tools are great for organizing information and finding solutions step-by-step. Don't worry if you're new to this we'll walk through each problem together!
Problem 1: Saving for a New Bike
Imagine you want to buy a new bike that costs $240. You have $50 saved already, and you can save $15 each week from your allowance. How many weeks will it take to reach your goal?
Let's set up a T-table to solve this:
    Weeks | Money Saved
    0     | $50
    1     | $65
    2     | $80
    3     | $95
    4     | $110
    5     | $125
    6     | $140
    7     | $155
    8     | $170
    9     | $185
    10    | $200
    11    | $215
    12    | $230
    13    | $245
We start with $50 and add $15 each week. After 13 weeks, we've saved $245, which is enough to buy the bike. The T-table helps us visualize the progress and find the answer easily.
Problem 2: Planning a Road Trip
You're planning a road trip that's 360 miles long. Your car travels at an average speed of 60 miles per hour. How long will the trip take if you make three 30-minute stops along the way?
Let's use a T-table to break this down:
    Hours | Miles Traveled
    1     | 60
    2     | 120
    3     | 180
    4     | 240
    5     | 300
    6     | 360
The T-table shows us it takes 6 hours of driving time to cover 360 miles. Now, let's add the stops:
    Driving time:   6 hours
    3 stops x 0.5 hours: 1.5 hours
    Total time:     7.5 hours
So, the total trip time is 7.5 hours.
Problem 3: Comparing Phone Plans
You're choosing between two phone plans: Plan A: $20 monthly fee + $0.10 per minute Plan B: $50 monthly fee with unlimited minutes How many minutes would you need to use for Plan B to be cheaper?
Let's create a T-table to compare the costs:
    Minutes | Plan A Cost | Plan B Cost
    0       | $20         | $50
    100     | $30         | $50
    200     | $40         | $50
    300     | $50         | $50
    400     | $60         | $50
The T-table shows that at 300 minutes, both plans cost $50. After this point, Plan B becomes cheaper. So, if you use more than 300 minutes per month, Plan B is the better choice.
Using T-tables for problem-solving helps us organize information clearly and see patterns easily. They're especially useful for problems involving steady increases or decreases over time or quantity. Remember, the key steps are: 1. Identify the important variables 2. Set up your T-table with clear headers 3. Fill in the data step-by-step 4. Look for the point where your answer becomes clear
Practice creating T-tables for different scenarios, and you'll find they're a powerful tool for tackling all sorts of real-world math problems involving money, time, and more. Happy problem-solving!
Shrinking Patterns in T-Tables
Let's explore the exciting world of shrinking patterns in T-tables! Imagine you're at an arcade, ready for a fun-filled day of games. You start with a certain amount of money, and as you play, your funds gradually decrease. This is a perfect example of a shrinking pattern, and we can use a T-table to visualize it.
A T-table is a great tool for organizing and understanding patterns. It has two columns: one for the input (like time spent at the arcade) and one for the output (like the money you have left). In a shrinking pattern, the numbers in the output column get smaller as the input increases.
Let's create a T-table for our arcade adventure! Suppose you start with $20 and spend $2 every 15 minutes. Here's how we'd fill out the table:
- At 0 minutes: $20
- At 15 minutes: $18
- At 30 minutes: $16
- At 45 minutes: $14
- At 60 minutes: $12
To fill out this table, we start with our initial amount and subtract $2 for each 15-minute interval. This creates a clear shrinking pattern as time passes.
Now, let's interpret the results. What can we learn from this T-table? First, we can see that our money decreases at a steady rate. Every 15 minutes, we lose $2. This is called the rate of change in T-tables. We can also predict how much money we'll have at any given time. For example, after 1 hour and 15 minutes (75 minutes), we'd have $10 left.
Shrinking patterns aren't just about money, though! They can represent many real-life situations where something decreases over time. Think about a melting ice cube, a battery draining, or even a balloon slowly deflating. All of these can be represented with shrinking patterns in T-tables.
To create your own T-table for a shrinking pattern, follow these steps:
- Identify your starting value and the amount it decreases by each step.
- Choose regular intervals for your input column (like every 15 minutes in our arcade example).
- Start with your initial value in the output column.
- Subtract the decrease amount for each subsequent row.
Remember, practice makes perfect! Try creating T-tables for different scenarios. Maybe track how many cookies are left in a jar as people eat them, or how much water is left in a bottle as you drink from it. The more you practice, the better you'll become at recognizing and working with shrinking patterns.
Understanding shrinking patterns in T-tables is an important skill that will help you in many areas of math and real-life problem-solving. Keep exploring, and don't be afraid to ask questions. You're doing great, and with each T-table you create, you're getting better at understanding these fascinating patterns!
Advanced Concepts in T-Tables
As you become more comfortable with basic T-tables, it's time to explore some advanced concepts that will challenge your analytical skills and deepen your understanding. One of the most intriguing aspects of advanced T-tables is working with non-consecutive numbers in the left column. This seemingly small change can significantly alter how we approach and interpret the data.
Imagine a T-table where the left column jumps from 2 to 5, then to 8, and so on. At first glance, this might appear confusing, but it's an excellent opportunity to flex your pattern recognition muscles. The key is to identify the relationship between these non-consecutive numbers. Is there a consistent difference? Perhaps they're multiples of a certain number? By answering these questions, you'll uncover the underlying pattern and be able to predict the next numbers in the sequence.
Another challenging aspect of advanced T-tables is dealing with seemingly unordered data. Unlike the neat, predictable patterns you've encountered before, these tables might present information that appears random at first. Don't be discouraged! This is where your detective skills come into play. Look for subtle relationships between the numbers in both columns. Sometimes, the pattern might involve alternating operations or a combination of mathematical functions.
For example, consider a T-table where the right column seems to fluctuate unpredictably. Upon closer inspection, you might discover that every odd-numbered row is the result of multiplying the left column by 2, while every even-numbered row is the result of adding 3 to the previous result. Recognizing these complex patterns requires patience and a willingness to experiment with different approaches.
As you tackle these more advanced T-tables, remember that the process of discovery is just as important as finding the correct answer. Don't be afraid to make mistakes or pursue ideas that might not pan out. Each attempt brings you closer to understanding the underlying structure of the data.
One effective strategy for working with complex patterns is to break them down into smaller, manageable parts. Instead of trying to decipher the entire table at once, focus on a few rows at a time. Look for mini-patterns within these subsets, then see if you can extend those patterns to the rest of the table. This approach can help you identify recurring elements or cycles within the larger pattern.
Another useful technique is to graph the data points from your T-table. Sometimes, visual representation can reveal patterns that aren't immediately obvious in numerical form. Pay attention to any curves, straight lines, or repeating shapes in your graph these can provide valuable clues about the relationship between the two columns.
As you become more adept at recognizing and working with these advanced patterns, you'll find that your problem-solving skills improve across all areas of mathematics. The ability to identify structure in seemingly chaotic data is a valuable skill that extends far beyond T-tables.
Remember, the goal isn't just to find the right answer, but to develop a deeper understanding of mathematical relationships. Each complex pattern you unravel strengthens your analytical abilities and prepares you for even more challenging problems in the future. Embrace the challenge, stay persistent, and don't hesitate to ask for help when you need it. With practice and determination, you'll soon find yourself confidently tackling even the most intricate T-tables.
Conclusion and Review
As we wrap up our exploration of T-tables and patterns, let's review the key points. T-tables are powerful tools for organizing data, helping us visualize relationships between variables. Patterns, whether in numbers, shapes, or real-world scenarios, provide insights into underlying structures and behaviors. The introduction video we watched was crucial in laying the foundation for these concepts, so don't hesitate to revisit it if needed. Now, it's time to put your knowledge into practice! Challenge yourself to work with T-tables in various contexts, from mathematical problems to everyday situations. Look for patterns in nature, music, or even your daily routines. Remember, the more you practice, the sharper your skills will become. This journey of discovery is just beginning, and there's so much more to explore. Stay curious, keep asking questions, and continue learning. You're well on your way to becoming a master of T-tables and organizing data!
Introduction to Showing Patterns in T-tables: What is a T-table?
In this guide, we will explore the concept of T-tables, their structure, and how they are used to show patterns. T-tables are a fundamental tool in mathematics for organizing data and identifying relationships between different sets of numbers. Let's dive into the details step by step.
Step 1: Understanding the Structure of a T-table
A T-table is a type of table that is used to organize data into columns and rows. The name "T-table" comes from the way the table is structured, which resembles the letter "T". Typically, a T-table consists of two main columns and multiple rows. Each column represents a different category of data, and each row represents a specific data point or pair of related data points.
For example, in a T-table, the first column might represent a sequence of numbers (e.g., 1, 2, 3, 4, 5), while the second column represents corresponding values that have a specific relationship with the numbers in the first column. This structure allows us to easily see and analyze the relationships between the data points.
Step 2: Why is it Called a T-table?
The reason it is called a T-table is due to its visual appearance. When you look at the table, you will notice that the columns are divided by a vertical line, and the rows are divided by horizontal lines. This creates a visual representation that looks like the letter "T". The top part of the "T" represents the column headers, and the vertical line represents the division between the two main columns.
This simple yet effective structure makes it easy to organize and compare data, which is why T-tables are commonly used in various mathematical and scientific applications.
Step 3: How Does a T-table Work?
In most cases, T-tables are used to display numerical data that follows a specific pattern or relationship. The first column typically contains a sequence of numbers, such as consecutive integers (1, 2, 3, 4, 5). These numbers often represent steps, terms, or other sequential data points.
The second column contains corresponding values that are related to the numbers in the first column. For example, if the first column contains the numbers 1, 2, 3, 4, 5, the second column might contain the values 3, 6, 9, 12, 15. In this case, there is a clear relationship between the numbers in the first column and the values in the second column: each value in the second column is three times the corresponding number in the first column.
This relationship can be easily identified and analyzed using the T-table, making it a powerful tool for understanding and visualizing patterns in data.
Step 4: Identifying Patterns in T-tables
One of the main purposes of using T-tables is to identify and analyze patterns in data. By organizing data into a T-table, we can easily see how the values in the second column change in relation to the values in the first column. This allows us to identify any consistent patterns or relationships between the data points.
For example, in the T-table mentioned earlier, we can see that the values in the second column increase by 3 for each step in the first column. This consistent pattern indicates a linear relationship between the two sets of numbers. By identifying such patterns, we can make predictions about future data points and gain a deeper understanding of the underlying relationships in the data.
Step 5: Practical Applications of T-tables
T-tables are used in a wide range of practical applications, from simple arithmetic problems to complex scientific research. In mathematics, T-tables are often used to solve problems involving sequences, series, and functions. They are also used in statistics to organize and analyze data sets, and in science to track experimental results and identify trends.
For example, in a science experiment, a T-table might be used to record the results of different trials, with the first column representing the trial number and the second column representing the measured outcome. By organizing the data in this way, researchers can easily compare results and identify any patterns or trends that emerge.
Conclusion
In summary, T-tables are a valuable tool for organizing and analyzing data. Their simple structure makes it easy to identify patterns and relationships between different sets of numbers, making them an essential tool in mathematics, science, and many other fields. By understanding how to use T-tables effectively, you can gain deeper insights into your data and make more informed decisions based on the patterns you observe.
FAQs
Q1: What is a T-table and how is it used in mathematics?
A T-table is a visual tool used in mathematics to organize and represent relationships between two sets of data or variables. It's called a T-table because of its T-shaped structure, with two columns separated by a vertical line and a horizontal line at the top. T-tables are used to show input-output relationships, compare values, and identify patterns in number sequences. They're particularly useful in algebra for solving equations and graphing functions.
Q2: How can I identify growing patterns in a T-table?
To identify growing patterns in a T-table, follow these steps:
1. Observe the first few terms in the output column.
2. Calculate the difference between consecutive terms.
3. Check if this difference is consistent throughout the table.
4. If the difference is constant, you've identified a linear growing pattern.
5. If the difference isn't constant, look for other relationships, such as multiplication or exponents.
Remember, growing patterns show an increase in values as you move down the table.
Q3: What are some real-world applications of T-tables?
T-tables have numerous real-world applications, including:
1. Financial planning: Tracking savings growth or debt reduction over time.
2. Science experiments: Recording observations at different time intervals.
3. Sports statistics: Comparing player performance across seasons.
4. Project management: Monitoring task completion rates.
5. Cooking: Scaling recipe ingredients for different serving sizes.
These applications demonstrate how T-tables can organize data and reveal patterns in various fields.
Q4: How do I create a T-table for a shrinking pattern?
To create a T-table for a shrinking pattern:
1. Start with your initial value in the output column.
2. Determine the rate of decrease for each step.
3. Choose regular intervals for your input column (e.g., time, trials).
4. Subtract the decrease amount from the previous value for each subsequent row.
5. Continue this process until you reach your desired endpoint or the pattern becomes clear.
Shrinking patterns are common in scenarios like depreciation, resource depletion, or countdown sequences.
Q5: What are some advanced concepts in T-tables?
Advanced concepts in T-tables include:
1. Working with non-consecutive numbers in the input column.
2. Identifying complex patterns that involve multiple operations.
3. Analyzing non-linear relationships between input and output.
4. Using T-tables to solve systems of equations.
5. Applying T-tables to trigonometric functions and their relationships.
These advanced concepts require a deeper understanding of mathematical relationships and often involve more sophisticated problem-solving techniques.
Prerequisite Topics
Understanding the foundations of mathematics is crucial when delving into more advanced concepts like showing patterns in T-tables. This skill is built upon several key prerequisite topics that provide the necessary groundwork for comprehension and application.
One of the fundamental concepts to grasp is the relationship between two variables. This understanding forms the basis of T-tables, as they visually represent how one variable changes in relation to another. By mastering this concept, students can more easily interpret the patterns that emerge in T-tables.
Another crucial prerequisite is familiarity with distance and time related questions in linear equations. These types of problems often utilize T-tables to organize data and reveal patterns, making this knowledge invaluable when working with more complex T-table scenarios.
The ability to graph functions using T-tables is also essential. This skill allows students to visualize the patterns they observe in the tables, reinforcing their understanding of the relationships between variables.
An understanding of number sequences is beneficial when working with T-tables, as many patterns in these tables follow specific numerical progressions. This knowledge helps in predicting and extending patterns observed in the data.
The concept of rate of change in T-tables is crucial for interpreting the patterns they display. This understanding allows students to analyze how quickly one variable changes in relation to another, a key aspect of pattern recognition in T-tables.
Grasping the domain and range of a function is important when working with T-tables, as it helps in determining the appropriate values to include and the limits of the patterns observed.
While not directly related to T-tables, knowledge of parallel and perpendicular line segments can be helpful when interpreting certain patterns, especially those related to linear relationships.
Lastly, proficiency in organizing data is essential for creating and interpreting T-tables effectively. This skill ensures that the information is presented clearly, making pattern recognition more straightforward.
By mastering these prerequisite topics, students will be well-equipped to tackle the challenges of showing patterns in T-tables. Each concept builds upon the others, creating a strong foundation for understanding this important mathematical skill.