Likelihood for simple events
Topic Notes
In this lesson, we will learn:
- What is the likelihood of different probability events?
- The likelihood of an event can either be: impossible, unlikely, as likely as not, likely, or certain
- How to understand likelihood using a probability line (probability number line)
Notes:
- The probability of an event is a value of how likely it is to happen. We can quantify the chances of something happening using a probability fraction: (event) =
- The likelihood of an event can be described using the following phrases:
- Impossible - it will never happen
- Unlikely - low chances of happening (less than half the chances)
- As likely as not - just as likely to happen as to not happen (even chances; exactly half the chances)
- Likely - high chances of happening (more than half the chances)
- Certain - it will always happen (happen for sure)
- How does the value of the probability fraction represent the likelihood of an event?
- It can tell us how likely or unlikely something is to happen.
- The tool we can use to help us understand likelihood is the probability number line (probability line)

- The probability line goes from 0 to 1 because the smallest probability fraction for any event is 0 out of any number of outcomes. The greatest probability fraction for any event is that it always happens (100% of the time = fraction of 1 whole).
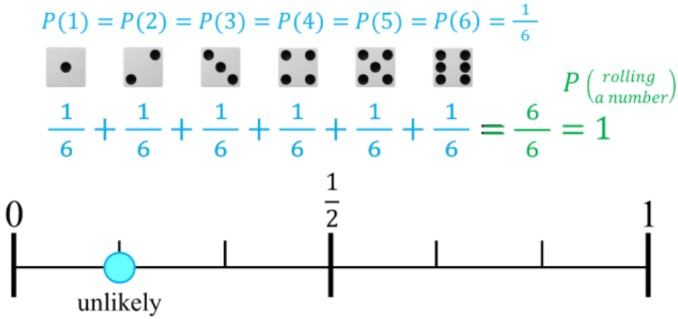
- Ex. For rolling a six-sided die, there is a 1 in 6 chance to land on any numbered side. Rolling any of the six numbers has a low chance (all the outcomes are unlikely events).
- If you add all the probability fractions of all outcomes, the answer will be 1 whole (considering every single possible result)
Introduction to Likelihood for Simple Events
Welcome to our exploration of likelihood for simple events, a fundamental concept in probability theory. Our journey begins with an engaging introduction video that lays the groundwork for understanding probability. This visual presentation is crucial in grasping the core principles of likelihood. As we delve deeper, we'll uncover the intricacies of probability fractions, providing you with the tools to quantify the chances of various outcomes. We'll also introduce the probability number line, a visual aid that helps in comparing and contrasting different likelihoods. Throughout this lesson, we'll examine various types of likelihoods, from certain events to impossible ones, and everything in between. By the end of this section, you'll have a solid foundation in probability concepts, enabling you to analyze simple events with confidence. Whether you're a student or a professional, mastering these basics is essential for tackling more complex probability problems in the future.
Understanding Probability Fractions
Probability fractions are a fundamental concept in mathematics and statistics, providing a quantitative measure of the likelihood of an event occurring. At its core, a probability fraction represents the ratio of favorable outcomes to the total number of possible outcomes in a given scenario. This concept is crucial for understanding and predicting the chances of various events in both everyday life and scientific contexts.
The probability formula is typically expressed as:
Probability = (Number of Desired Outcomes) / (Total Number of Possible Outcomes)
This formula encapsulates the essence of probability fractions, providing a clear and concise way to calculate the likelihood of an event. Let's explore this concept using common examples that many of us encounter in everyday life or games of chance.
Consider the classic example of flipping a coin. When you flip a fair coin, there are two possible outcomes: heads or tails. If we're interested in the probability of getting heads, we have one desired outcome (heads) out of two total possible outcomes (heads or tails). Applying our formula:
Probability of Heads = 1 (desired outcome) / 2 (total outcomes) = 1/2 or 0.5 or 50%
This means that each time you flip a fair coin, there's a 50% chance of getting heads. The same probability applies to getting tails, as the outcomes are mutually exclusive and equally likely.
Now, let's consider a slightly more complex example: rolling a six-sided die. Suppose we want to know the probability of rolling an even number. In this case, there are three desired outcomes (2, 4, and 6) out of six total possible outcomes (1, 2, 3, 4, 5, and 6). Applying our formula:
Probability of Rolling an Even Number = 3 (desired outcomes) / 6 (total outcomes) = 1/2 or 0.5 or 50%
Interestingly, we arrive at the same probability as flipping a coin, despite the increased number of outcomes. This illustrates how probability fractions can reveal similarities between seemingly different scenarios.
Probability fractions are intrinsically linked to the concept of likelihood. The higher the probability fraction, the more likely an event is to occur. Conversely, a lower probability fraction indicates a less likely event. This relationship allows us to make informed decisions and predictions based on quantifiable data.
It's important to note that probability fractions always fall within the range of 0 to 1, or when expressed as percentages, 0% to 100%. A probability of 0 (or 0%) indicates an impossible event, while a probability of 1 (or 100%) represents a certain event. Most real-world probabilities fall somewhere between these extremes.
For instance, the probability of rolling a 7 on a standard six-sided die is 0, as this outcome is impossible. On the other hand, the probability of rolling a number between 1 and 6 (inclusive) on the same die is 1, as this outcome is certain.
Understanding probability fractions enables us to analyze complex situations, make predictions, and assess risks in various fields, from weather forecasting and financial investments to scientific research and game theory. By breaking down events into desired outcomes and total possible outcomes, we can quantify uncertainty and make more informed decisions.
In conclusion, probability fractions provide a powerful tool for understanding and quantifying the likelihood of events. By mastering this concept, we can better navigate the uncertainties of life and make more informed choices based on calculated probabilities. Whether you're analyzing coin flips, dice rolls, or more complex real-world scenarios, the principles of probability fractions remain a cornerstone of statistical reasoning and decision-making.
The Probability Number Line
The probability number line is a powerful visual tool that helps us understand and represent the likelihood of events occurring. This linear representation stretches from 0 to 1, where 0 signifies impossible events and 1 represents certain events. By plotting probabilities on this line, we can easily compare and analyze the chances of different outcomes.
To use the probability number line effectively, we start by identifying the two extremes. On the left end, we have 0, which represents events that have no chance of happening. For example, the probability of a coin landing on its edge is practically zero. On the right end, we have 1, which represents events that are guaranteed to occur, such as the sun rising tomorrow.
Between these two points, we can plot various probabilities as fractions or decimals. For instance, if we're considering the likelihood of rolling an even number on a six-sided die, we would plot 1/2 or 0.5 on the number line. This is because there are three even numbers (2, 4, and 6) out of the six possible outcomes, giving us a probability of 3/6, which simplifies to 1/2.
The halfway point on the probability number line, 0.5, holds special significance. It represents events that are equally likely to happen or not happen in other words, events that are 'as likely as not' to occur. This point is crucial for understanding balanced probabilities and can be used as a reference when comparing other events.
Let's consider some examples from everyday life to illustrate these concepts. The probability of drawing a red card from a standard deck is 26/52 or 1/2, which would be plotted exactly at the halfway point of our number line. On the other hand, the chance of rolling a 7 on a standard six-sided die is 0, as this outcome is impossible and would be plotted at the far left of our line.
The probability number line also helps us visualize comparative likelihoods. For instance, if we're looking at weather forecasts, a 30% chance of rain (0.3 on our line) is less likely than a 60% chance (0.6 on our line). By plotting these probabilities, we can quickly see that the latter scenario is twice as likely to occur.
Understanding how to use the probability number line is essential in various fields, from statistics and data science to risk assessment and decision-making. It allows us to represent complex probabilistic concepts in a simple, intuitive format that's easy to interpret at a glance.
Moreover, the probability number line serves as a foundation for more advanced probability concepts. As we move beyond basic events, we can use this visualization to understand compound probabilities, conditional probabilities, and even probability distributions. The line can be extended to include negative numbers for certain types of statistical analyses, further expanding its utility.
In conclusion, the probability number line is an indispensable tool for visualizing likelihood. By representing probabilities from 0 to 1, with special attention to the halfway point of 0.5, we can effectively communicate and analyze the chances of various events occurring. Whether you're a student learning basic probability theory or a professional working with complex statistical models, mastering the use of the probability number line will enhance your ability to understand and convey probabilistic information accurately and efficiently.
Types of Likelihood
Understanding the different types of likelihood is crucial in probability theory and statistics. These likelihoods help us quantify the chances of events occurring and make informed decisions based on those probabilities. In this section, we'll explore five key types of likelihood: impossible, unlikely, as likely as not, likely, and certain.
Starting with "impossible," this term refers to events that have absolutely no chance of occurring. On the probability number line, impossible events are represented by 0. For example, the likelihood of a coin landing on its edge and staying perfectly balanced is considered impossible in practical terms. Another example would be drawing a red card from a deck containing only black cards.
Moving along the probability spectrum, we encounter "unlikely" events. These are occurrences that have a low probability of happening but are not entirely impossible. On the number line, unlikely events fall closer to 0 than to 1. For instance, winning the lottery is an unlikely event. While it's possible, the chances are very slim. Another example could be experiencing a white Christmas in a typically warm climate it's not impossible, but it's certainly not common.
In the middle of the probability range, we find events that are "as likely as not." This term describes situations where the chances of an event occurring or not occurring are roughly equal. On the probability number line, these events are represented by 0.5 or 50%. A classic example is flipping a fair coin the probability of getting heads is as likely as getting tails. Another instance could be predicting whether it will rain or not on a day with mixed weather conditions.
As we move further along the spectrum, we encounter "likely" events. These are occurrences that have a high probability of happening but are not absolutely certain. On the number line, likely events fall closer to 1 than to 0. For example, the likelihood of a professional basketball player successfully making a free throw is considered likely. Another instance could be the probability of a student passing an exam after thorough preparation it's highly probable but not guaranteed.
At the far end of the probability spectrum, we have "certain" events. These are occurrences that are guaranteed to happen, with a probability of 1 on the number line. The most commonly cited example of a certain event is the sun rising tomorrow. Barring any catastrophic cosmic events, we can be virtually certain that the sun will indeed rise the next day. This example serves as an excellent analogy for understanding certainty in probability.
The sun rising tomorrow is considered a certain event due to our understanding of the Earth's rotation and its relationship with the sun. The consistency and reliability of this natural phenomenon make it an ideal representation of certainty in everyday life. While technically not 100% guaranteed (as there could be extremely rare cosmic events that might interfere), for all practical purposes, we treat it as a certain event.
Understanding these different types of likelihood helps us navigate various real-world scenarios and make informed decisions. For instance, in weather forecasting, meteorologists use these concepts to communicate the probability of different weather conditions. A "likely" chance of rain might prompt you to carry an umbrella, while an "unlikely" chance might not affect your plans as much.
In the field of risk assessment, these likelihood categories play a crucial role. Insurance companies, for example, use these concepts to determine premiums and coverage. Events that are "likely" or "certain" may result in higher premiums or exclusions, while "unlikely" events might be covered at a lower cost.
It's important to note that these likelihood categories exist on a continuous spectrum. Between "impossible" and "unlikely," there are varying degrees of improbability. Similarly, between "likely" and "certain," there are different levels of high probability. The specific categorization often depends on the context and the precision required for a given situation.
In conclusion, the five types of likelihood impossible, unlikely, as likely as not, likely, and certain provide a framework for understanding and communicating probabilities. From the impossibility of certain events to the certainty of others, like the sun rising tomorrow, these concepts help us make sense of the world around us and make informed decisions based on the likelihood of various outcomes.
Simple Event Examples: Coins, Dice, and Spinners
Understanding probability through simple events is crucial in mathematics and statistics. Let's explore detailed examples using coins, dice, and spinners to illustrate key concepts in probability theory.
Coin Toss Example
A fair coin toss is a classic example of a simple event with equally likely outcomes. When you flip a coin, there are only two possible outcomes: heads (H) or tails (T). The probability of getting heads is 1/2, and the same goes for tails. On a probability number line, both outcomes would be plotted at 0.5.
Probability of Heads (H) = 1/2 = 0.5
Probability of Tails (T) = 1/2 = 0.5
The sum of these probabilities is 1 (0.5 + 0.5 = 1), which is a fundamental rule in probability theory. This example demonstrates equally likely outcomes, as both heads and tails have the same chance of occurring.
Die Roll Example
Rolling a fair six-sided die is another example of a simple event with equally likely outcomes. Each number (1, 2, 3, 4, 5, 6) has an equal probability of being rolled. The probability of rolling any specific number is 1/6.
Probability of rolling a 1 = 1/6 0.167
Probability of rolling a 2 = 1/6 0.167
Probability of rolling a 3 = 1/6 0.167
Probability of rolling a 4 = 1/6 0.167
Probability of rolling a 5 = 1/6 0.167
Probability of rolling a 6 = 1/6 0.167
On a probability number line, each outcome would be plotted at approximately 0.167. Again, the sum of all probabilities equals 1 (6 * 1/6 = 1). This example reinforces the concept of equally likely outcomes in a fair die roll.
Spinner Example
A spinner provides an excellent opportunity to explore unequal probabilities. Let's consider a spinner divided into four unequal sections: red (1/2 of the spinner), blue (1/4), green (1/8), and yellow (1/8).
Probability of landing on Red = 1/2 = 0.5
Probability of landing on Blue = 1/4 = 0.25
Probability of landing on Green = 1/8 = 0.125
Probability of landing on Yellow = 1/8 = 0.125
On a probability number line, these outcomes would be plotted at 0.5, 0.25, 0.125, and 0.125 respectively. This example clearly illustrates unequal probabilities, as the chance of landing on red is significantly higher than landing on green or yellow. However, the sum of all probabilities still equals 1 (0.5 + 0.25 + 0.125 + 0.125 = 1).
Comparing Equally Likely and Unequal Probabilities
The coin toss and die roll examples demonstrate equally likely outcomes. In these cases, each possible outcome has the same probability of occurring. This is a characteristic of many simple random events and forms the basis for many probability calculations.
In contrast, the spinner example showcases unequal probabilities. Here, some outcomes are more likely than others, reflecting real-world scenarios where certain events may have a higher chance of occurring. Despite these differences,
Applying Likelihood Concepts to Real-World Situations
The concepts of likelihood and probability extend far beyond simple games of chance, offering valuable insights into real-world situations and decision-making processes. Understanding these principles can significantly enhance our ability to interpret data and make informed choices in complex scenarios.
In the realm of business and finance, likelihood plays a crucial role in risk assessment and investment strategies. For instance, insurance companies use probability models to determine premiums based on the likelihood of various events occurring. Similarly, investors analyze market trends and economic indicators to estimate the probability of certain outcomes, much like calculating the odds of rolling a specific number on a die, but with far more variables involved.
Weather forecasting is another area where likelihood concepts are extensively applied. Meteorologists use complex models to predict the probability of different weather conditions, helping individuals and organizations plan accordingly. This application mirrors the principles of simple event probability, but on a much larger scale with numerous interacting factors.
In healthcare, medical professionals use probability to assess the likelihood of diseases based on symptoms and test results. This process is analogous to determining the probability of drawing a specific card from a deck, but with the added complexity of multiple, often interrelated, factors. Understanding these probabilities helps in diagnosing conditions and determining the most effective treatment plans.
The field of quality control in manufacturing also heavily relies on probability concepts. By sampling products and applying statistical methods, companies can estimate the likelihood of defects in their production lines. This application extends the idea of simple event probability to large-scale production processes, enabling efficient quality management.
In the digital age, data science and machine learning algorithms frequently employ probability theory. These technologies use historical data to predict future outcomes, whether it's recommending products to consumers or forecasting stock prices. The underlying principles are similar to calculating the probability of a coin toss, but applied to vast datasets with numerous variables.
Environmental scientists use probability models to assess the likelihood of natural disasters and climate change impacts. These models help in developing preparedness strategies and informing policy decisions. The complexity of these models far exceeds simple event probabilities, yet they are built on the same fundamental concepts.
In everyday decision-making, understanding likelihood can help individuals make more rational choices. For example, when considering career options, one might assess the probability of success in different fields based on various factors. This process is similar to weighing the odds in a game, but with more nuanced and personal considerations.
By applying likelihood concepts to these real-world situations, we can see how the same principles that govern simple events like coin tosses or dice rolls scale up to complex, multifaceted scenarios. The key lies in identifying relevant variables, gathering accurate data, and applying appropriate statistical methods to interpret probabilities effectively.
Conclusion
In this lesson, we explored fundamental concepts of probability, including probability fractions and the probability number line. We learned how to express likelihood using fractions between 0 and 1, with 0 representing impossibility and 1 indicating certainty. The probability number line provided a visual representation of these concepts, helping us understand the range of probabilities. We also discussed different types of likelihood, from highly improbable to extremely likely events. The introduction video on probability played a crucial role in presenting these ideas in a visual and interactive manner, making complex concepts more accessible. To solidify your understanding, it's essential to practice applying these concepts to various real-world situations. This will help you develop a stronger intuition for probability. As you become more comfortable with these foundational ideas, consider exploring more advanced probability topics to further expand your knowledge in this fascinating field of mathematics.
Introduction to Basic Probability for Simple Events: How to Describe the Likelihood of Something Happening
Understanding the likelihood of an event happening is a fundamental concept in probability. This guide will walk you through the steps to describe the likelihood of simple events using probability fractions and a probability number line.
Step 1: Understanding Probability
Probability is a measure of how likely an event is to occur. It is expressed as a fraction, where the numerator represents the number of favorable outcomes, and the denominator represents the total number of possible outcomes. This fraction is known as the probability fraction.
Step 2: The Probability Fraction
The probability of an event is calculated using the formula:
Probability (P) = Number of favorable outcomes / Total number of possible outcomes
For example, if you want to find the probability of rolling a 3 on a six-sided die, the probability fraction would be 1/6, since there is one favorable outcome (rolling a 3) and six possible outcomes (rolling any number from 1 to 6).
Step 3: Describing Likelihood with Words
To better understand and communicate the likelihood of an event, we use specific terms:
- Impossible: The event will never happen.
- Unlikely: There is a low chance of the event happening.
- As Likely As Not: The event is equally likely to happen or not happen.
- Likely: There is a high chance of the event happening.
- Certain: The event will definitely happen.
Step 4: The Probability Number Line
To visualize the probability fraction, we use a probability number line. This number line ranges from 0 to 1, where 0 represents an impossible event and 1 represents a certain event. The halfway mark (0.5) represents an event that is as likely as not to happen.
For example, if the probability fraction is 3/10, you would place a point three-tenths of the way from 0 to 1 on the number line.
Step 5: Plotting Fractions on the Number Line
To plot a fraction on the number line, follow these steps:
- Identify the total number of divisions on the number line (the denominator of the fraction).
- Count the number of spaces from the left (the numerator of the fraction).
- Place a point at the corresponding position on the number line.
For instance, if the fraction is 3/10, you would divide the segment between 0 and 1 into 10 equal parts and place a point at the third division from the left.
Step 6: Interpreting the Probability Number Line
Once you have plotted the probability fraction on the number line, you can interpret the likelihood of the event:
- If the point is close to 0, the event is unlikely to happen.
- If the point is close to 0.5, the event is as likely as not to happen.
- If the point is close to 1, the event is likely to happen.
This visual representation helps in understanding and communicating the likelihood of different events.
Step 7: Applying the Concept
To apply this concept, consider a real-world example. Suppose you have a bag with 5 red balls and 5 blue balls. The probability of drawing a red ball is 5/10 or 0.5. Plotting this on the number line, you place a point at the halfway mark, indicating that drawing a red ball is as likely as not.
By following these steps, you can effectively describe and understand the likelihood of simple events using basic probability concepts.
FAQs
-
What is the difference between probability and likelihood?
While often used interchangeably, probability and likelihood have distinct meanings in statistics. Probability refers to the chance of an event occurring and is calculated based on the number of favorable outcomes divided by the total number of possible outcomes. Likelihood, on the other hand, is a function that describes how well a statistical model fits observed data. In simple terms, probability is used to predict future events, while likelihood is used to evaluate how well a model explains observed data.
-
How do you calculate the probability of mutually exclusive events?
For mutually exclusive events (events that cannot occur simultaneously), the probability of either event occurring is the sum of their individual probabilities. For example, if the probability of rolling a 1 on a die is 1/6, and the probability of rolling a 2 is also 1/6, then the probability of rolling either a 1 or a 2 is 1/6 + 1/6 = 1/3.
-
What is the law of large numbers in probability theory?
The law of large numbers states that as the number of trials of a random process increases, the average of the results gets closer to the expected value. For instance, if you flip a fair coin many times, the proportion of heads will approach 50% as the number of flips increases. This law is fundamental in understanding how probability works in real-world applications and why larger sample sizes generally lead to more accurate predictions.
-
How does conditional probability differ from independent probability?
Conditional probability is the probability of an event occurring given that another event has already occurred. It's calculated using the formula P(A|B) = P(A and B) / P(B). Independent probability, conversely, means that the occurrence of one event does not affect the probability of another event. For independent events, P(A and B) = P(A) * P(B). Understanding the difference is crucial in many real-world scenarios where events may or may not influence each other.
-
What is the importance of understanding probability in everyday life?
Understanding probability is crucial in everyday life as it helps in making informed decisions under uncertainty. It's used in weather forecasting, financial planning, risk assessment, and even in understanding health risks. For example, knowing the probability of rain helps you decide whether to carry an umbrella, while understanding the odds in games of chance can help you make better gambling decisions. In broader terms, probability literacy enables critical thinking about statistics presented in news and research, helping to interpret information more accurately in various aspects of life.
Prerequisite Topics
Understanding the concept of likelihood for simple events is a fundamental aspect of probability theory and statistics. While this topic doesn't have any specific prerequisites listed, it's important to recognize that a strong foundation in basic mathematical concepts can greatly enhance your comprehension of likelihood and probability.
Likelihood for simple events is a concept that builds upon our intuitive understanding of chance and uncertainty. It quantifies the probability of a specific outcome occurring in a given scenario. To fully grasp this concept, students should be comfortable with basic arithmetic, fractions, and percentages, as these mathematical tools are often used to express and calculate probabilities.
Although not explicitly listed as prerequisites, familiarity with set theory and basic logic can be beneficial when studying likelihood. These concepts help in understanding how different events relate to each other and how to reason about probabilities in various situations. Additionally, a basic understanding of data representation and analysis can provide context for applying likelihood concepts in real-world scenarios.
While exploring likelihood for simple events, students will encounter terms such as "sample space," "favorable outcomes," and "equally likely events." These concepts form the building blocks for more advanced probability topics. Having a solid grasp of these foundational ideas will make it easier to progress to more complex probability concepts in the future.
It's worth noting that likelihood for simple events is often an entry point into the broader field of probability theory. As such, it serves as a prerequisite for more advanced topics like conditional probability, Bayes' theorem, and probability distributions. Mastering this concept will pave the way for a deeper understanding of statistical inference and data analysis techniques.
In practical applications, likelihood for simple events is used in various fields, including science, engineering, finance, and decision-making processes. Understanding this concept can help in assessing risks, making predictions, and interpreting data-driven results. This wide applicability underscores the importance of building a strong foundation in the basics of probability.
As students delve into the study of likelihood for simple events, they should approach the topic with curiosity and an open mind. Engaging with practical examples and real-world applications can help reinforce the theoretical concepts and demonstrate their relevance in everyday situations. By doing so, students will not only gain proficiency in calculating probabilities but also develop critical thinking skills that are valuable across many disciplines.
In conclusion, while there are no specific prerequisites listed for likelihood for simple events, a strong mathematical foundation and an understanding of basic logical reasoning will greatly benefit students approaching this topic. As they progress in their studies, the concepts learned here will serve as crucial building blocks for more advanced probability and statistics courses, making it an essential topic in the mathematical curriculum.