Probability distribution - histogram, mean, variance & standard deviation
0/1
Intros
0/2
Examples
Lessons
- Probability Histogram, Mean, Variance and Standard Deviation
The following table gives the probability distribution of a loaded (weighted) die:
outcome
probability
1
0.05
2
0.10
3
0.30
4
0.33
5
0.15
6
0.07


Topic Notes
Table of Contents:
- Probability distribution: histogram, mean, variance and standard deviation
- What is a probability distribution?
- Types of probability distribution
- Discrete probability distributions
- Continuous distributions
- How to find the mean of a probability distribution?
- How to find the standard deviation of a probability distribution?
- Example 1
Probability distribution: histogram, mean, variance and standard deviation
For most of this statistics course we have dedicated our time to frequency distributions and their many different graphic representations; it is time now, finally, to take a look into probability distributions: those which produce graphs where the vertical axis depicts the probability of a certain outcome during and experiment and not the frequency.
What is a probability distribution?
A probability distribution is a tool that allows us to understand the values that a random variable may produce. For that, we need to learn about probability and random variables.
Probability refers to the chances of an outcome to occur in a random process, such particular outcome arises from a set of all possible outcomes in the experiment. In other words, when performing a statistical study, data collection procedure or any other experiment defined as a random process, there are a variety of possible results from such experiment but there is no way for the experimenter to know what each outcome from each trial will be; therefore, probability allows us make a guess of each possible outcome value based on the results producen through multiple earlier trials or the mathematical calculated possibility of it occurring based on the proportion of each value in the set of possible values. In simple words, probability gives an idea on how likely is an outcome to result from an experiment.
The probability of a specific value of a random variable to occur is mathematically defined as:
When recording the possible outcomes of a random experiment, each of the values produced as results throughout the experiment are what we call random variables. A random variable is formed by data points, each assuming a unique numerical value that has been produced through an experiment, and which is a random result of such experiment; therefore, there is no way to know for sure what the result values of a random variable will be, but we can use its recorded outcomes and the probability of each to study the behaviour of a population.
Random variables are classified into two categories depending on the type of values they can contain: Discrete random variables and continuous random variables.
A discrete random variable is that which contains countable values. What do we mean by countable? Well, these are whole numbers, integers. Therefore, discrete random variables refer to variables that deal with items that can be counted as complete units, not fractions or any infinitesimally small parts of a unit interval.
On the other hand a continuous random variable can have any possible value, as long as it belongs to a particular defined interval that is being studied. Simply said, a continuous random variable can assume any value within a specified interval of values assumed by the variable, that means that they can have values with decimal expressions or fractions; they are said to be continuous because they will contain every single value within the interval and that means that not matter how small scale can you go within an interval, this variable is taking account of it.
For example, let us say a continuous random variable being studied by us may have values within 0 and 5, that means the variable can have an outcome equal to 3.2 or 1.23456 or 4.123 or even 0.0000000000000000001 because is still in between the value of 0 to 5!
If this same range was to be used for a discrete random variable, the possible values of such variable would only be the complete numbers: 0, 1, 2, 3, 4, 5.
With this in mind, we can define a probability distribution as a list or graphic representation of all the possible values of a random variable and the probability of each of them occurring.
A probability distribution table is a table, just as the frequency distribution table, where the possible outcomes of a statistical experiment are listed, but instead of listing the frequency of occurrence of each outcome on their side, it presents the probability of each of them occurring.
Remember from our lesson on frequency distributions and histograms that a histogram is the graphic representation of a frequency distribution for one variable that resembles a bar-graph, where each bar or column in the graph represents the frequencies of consecutive ranges from class intervals in a frequency distribution table. Although this definition of a histogram is correct, it so happens that histograms are so basic and simple to construct that they can be used in many other ways, not only for frequency distributions!
Therefore, we can construct histograms for probability distributions and they can simply be called as a probability distribution graph.
A continuous probability distribution is a probability density function. The area under the smooth curve is equal to 1 and the frequency of occurrence of values between any two points equals the total area under the curve between the two points and the -axis
Types of probability distribution
There are two major types of probability distribution: discrete and continuous.
• Discrete probability distributions
Discrete probability distributions usually have integers as outcome values, and the sum of the probability of each of these outcomes is equal to 1, meaning that having all of the possible outcomes listed, there is a 100% of probability of obtaining any of them, or in other words, one of them has to occur in the experiment. This also means that the probability of each outcome can be expressed as a specific positive value from 0 to 1 (as shown in equation 1).
The most common types of discrete probability distributions are:
- The binomial distribution
- The poisson distribution
- The geometric distribution
- The hypergeometric distribution
- The negative binomial distribution
Each of them will be explained throughout the next lessons of this course.
• Continuous distributions
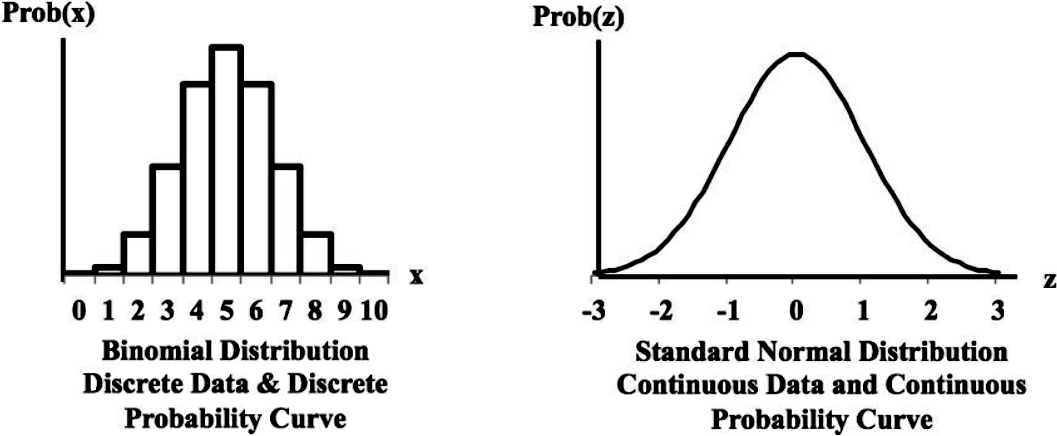
If we are to graph a continuous probability distribution, we would see a smooth probability curve due the nature of the infinite data points being graphed, then, the probability is the area under the curve for any interval piece. See figure 2 to observe an example of a continuous probability distribution graph.
The most common types of continuous probability distributions are:
- The normal distribution
- The uniform probability distribution
- The exponential probability distribution
As mentioned before, on this and the next few lessons we will be focused on studying discrete probability distributions such as the binomial, poisson, etc. Meanwhile, take a look at the difference of a graphic representation of a discrete probability distribution (left, with a binomial probability distribution) and a continuous probability distribution (right, with a standard normal probability distribution) below:
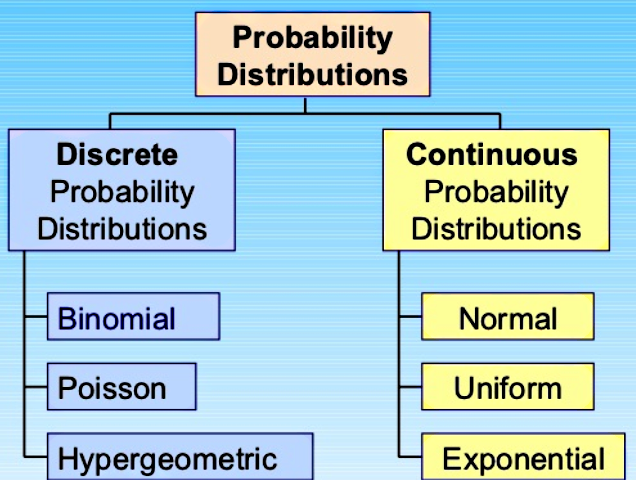
To summarize the probability distributions in a table, take a look at the next figure:
How to find the mean of a probability distribution?
For the case of discrete probability distributions, we can use as probability the probability mass function defined as p(x); therefore, in order to calculate the mean of a probability distribution we follow the next formula:Where represents the value of the random variable (the outcome), and is the probability mass function or pm f, which defines the probability of each outcome value of to occur.
How to find the standard deviation of a probability distribution?
We compute the standard deviation for a probability distribution function similarly to way that we compute the standard deviation for a population, except that after squaring , we multiply by the probability mass function and we do not need to divide by .
Notice that the variance of a probability distribution can be obtained once you have calculated the standard deviation.
In order to illustrate the process of calculating the mean, variance and standard deviation of a probability distribution let us take a look at the next example:
Example 1
The following table gives the probability distribution of a loaded (weighted) die: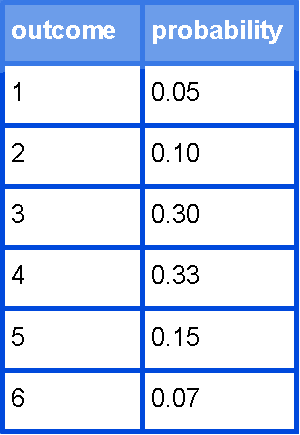
a) Find the mean, variance, and standard deviation of the probability distribution.
Using equation 2 we can compute the mean:
Then we use equation 3 to compute the variance and standard deviation:
b) Based on the range rule of thumb, determine the outcomes that are considered as usual and unusual.
In statistics the range rule of thumb is that which delimits a specific interval at which outcome values can be classified as usual or unusual, in order to find these range limits we use the mean and standard deviation to find:
If we use these rules to find the range of usual and unusual values we find that:
Therefore we find that the value of 1 is an unusual value, while the rest of them: 2, 3 , 4, 5 and 6 are all within the range of usual values.
To finalize this lesson we would like to recommend you to take a look at this lesson on probability and probability distributions which goes from basic concepts to extended examples on the matter. Also, this handbook on probability distributions takes care of covering everything in detail and we think it could be very useful for you in your independent studies, or while working in homework and other assignments.
This is it for our lesson of today, we will continue on discrete probability distributions during this whole fourth section on our statistics course so, see you in the next one!
For a probability distribution:
Range Rule of Thumb (Usual VS. Unusual):
maximum usual value
minimum usual value
Range Rule of Thumb (Usual VS. Unusual):
maximum usual value
minimum usual value