Pie charts
0/2
Intros
Lessons
0/10
Examples
Lessons
- The circle graph shows the types of activities that 200 students participated in during the school year.

- Compare the data in these two circle graphs.

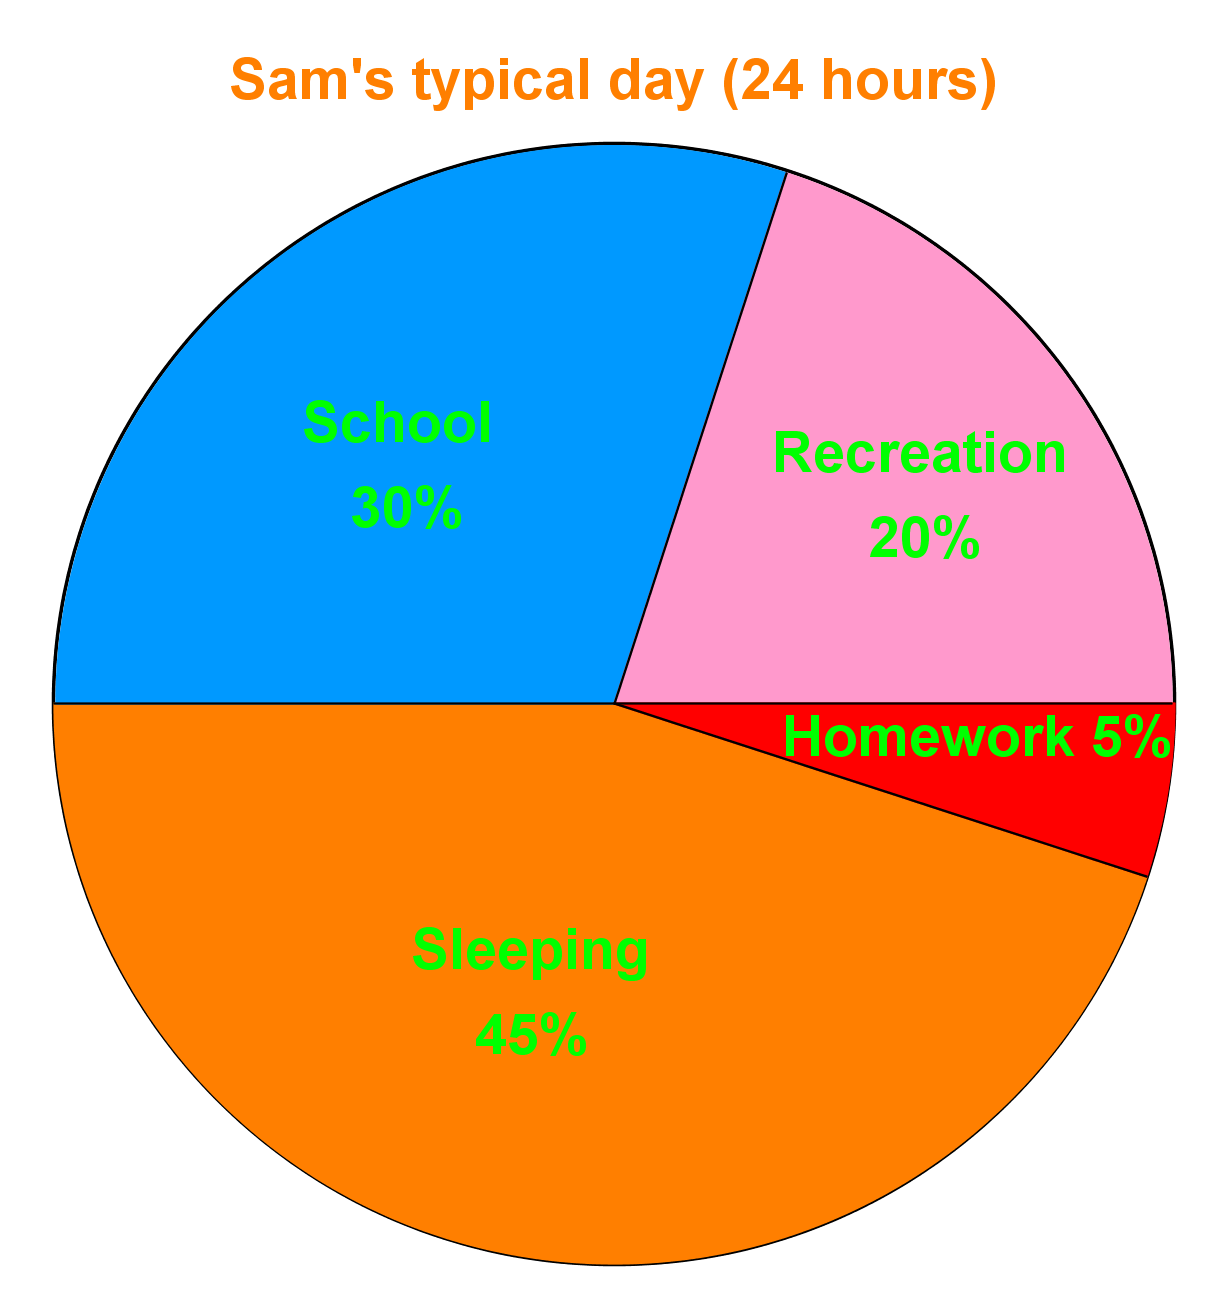
- Who spends more time sleeping in a typical day?
- How much longer does Alex spend on recreation activities than Sam in a typical day?
- Which activity do both Alex and Sam spend most of their time on?
- What is the difference between the measures of the central angles in the Recreation section of Alex and Sam's day?
- 30 grade 7 students were surveyed to determine their favorite type of pop.
- Could you use a circle graph to represent the following? Explain.