Understanding graphs of linear relationships
All You Need in One PlaceEverything you need for Year 6 maths and science through to Year 13 and beyond. | Learn with ConfidenceWe’ve mastered the national curriculum to help you secure merit and excellence marks. | Unlimited HelpThe best tips, tricks, walkthroughs, and practice questions available. |
Make math click 🤔 and get better grades! 💯Join for Free
0/8
Examples
Lessons
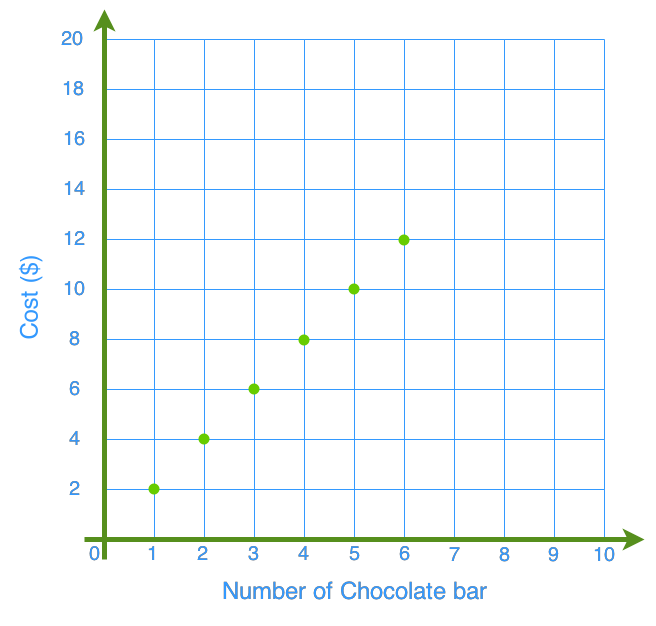
- The graph below shows the cost of chocolate bars.
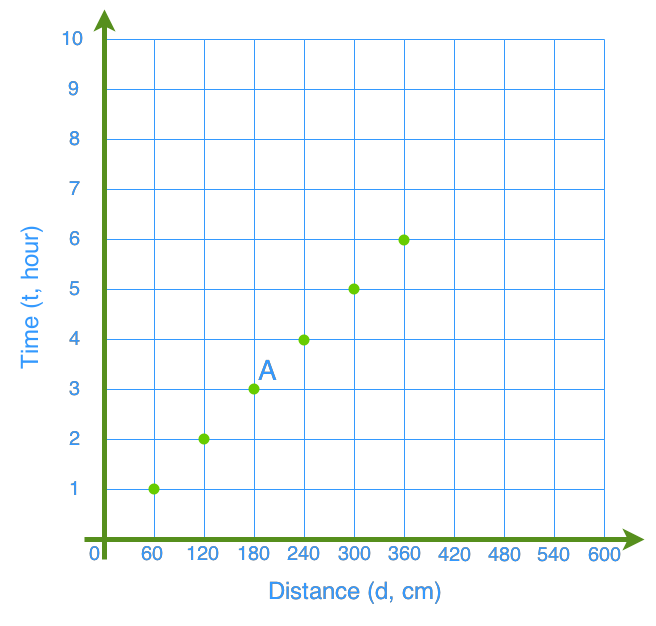
. - The graph shows the distance a car travels.
.


