Reading and drawing Venn diagrams
Topic Notes
Introduction to Venn Diagrams
Welcome to our introduction to Venn diagrams, a powerful tool in mathematics and data visualization. Venn diagrams are graphical representations that use overlapping circles or shapes to illustrate relationships between different sets of data. These diagrams, named after their creator John Venn, have become an essential part of logical reasoning and set theory. They're widely used in various fields, from mathematics and statistics to business and education. Our introductory video will guide you through the basics of Venn diagrams, helping you understand their structure and how to interpret them. You'll learn how to create simple Venn diagrams, identify intersections and unions, and apply these concepts to real-world scenarios. Whether you're a student encountering Venn diagrams for the first time or someone looking to refresh their knowledge, this video will provide a clear, friendly, and professional explanation. By the end, you'll have a solid foundation in this fundamental data visualization technique, ready to apply it in your studies or work.
Understanding the Basics of Venn Diagrams
A Venn diagram is a powerful visual tool used to represent relationships between different sets or groups. At its most basic, a Venn diagram can consist of a single circle. This circle represents a set or group of elements that share a common characteristic. Let's start with this simple concept to build our understanding of Venn diagrams.
Imagine a single circle drawn on a piece of paper. This circle represents a set, which could be any group of items or individuals that share a common trait. For example, let's consider a circle that represents "soccer players." Every element (in this case, a person) inside this circle is a soccer player. The circle acts as a boundary, clearly defining who belongs to this group and who doesn't.
In Venn diagrams, elements within sets are typically represented by dots or small symbols inside the circles. However, for larger sets, it's common to simply describe or label the set without individually representing each element. In our soccer player example, we might label the circle "Soccer Players" without drawing individual dots for each player.
The importance of circles in Venn diagrams cannot be overstated. Circles are the fundamental building blocks of these diagrams, providing a clear visual representation of sets or groups. The circular shape is ideal because it creates a distinct boundary between what's included in the set and what's not. This boundary is crucial for understanding set theory and the relationships between different groups.
Expanding on our soccer player example, let's consider how this single-circle Venn diagram helps us understand the concept. Inside the circle, we have all individuals who play soccer. This could include professional players, amateurs, children in school teams, and adults in recreational leagues. Outside the circle are all the people who don't play soccer. This simple representation allows us to quickly grasp who belongs to the "soccer player" group and who doesn't.
Venn diagrams can contain various types of sets or groups beyond just people. They can represent events, objects, ideas, or any other category you can think of. For instance, we could have a circle representing "fruits," "mammals," "countries in Europe," or "programming languages." The versatility of Venn diagrams makes them useful in many fields, including mathematics, logic, statistics, linguistics, and business.
As we delve deeper into Venn diagrams, we'll encounter more complex arrangements with multiple overlapping circles in Venn diagrams. These allow us to explore relationships between different sets, such as commonalities and differences. However, understanding the single-circle concept is crucial as it forms the foundation for more intricate Venn diagrams.
In conclusion, the single-circle Venn diagram introduces us to the core concept of sets and how they can be visually represented. By using circles to contain events, groups, or elements, Venn diagrams provide a clear and intuitive way to understand set theory and relationships between different categories. As we build on this basic concept, we can explore more complex relationships and gain deeper insights into various fields of study and real-world applications, including overlapping circles in Venn diagrams.
Overlapping Circles: The Heart of Venn Diagrams
Venn diagrams are powerful visual tools used to represent relationships between different sets of data. At the core of these diagrams lies a crucial element: overlapping circles. These intersecting shapes are not just aesthetically pleasing; they serve a vital purpose in illustrating how different groups or categories relate to one another. The concept of overlapping circles in Venn diagrams is fundamental to understanding set theory and logical relationships.
When we see overlapping circles in a Venn diagram, we're looking at a visual representation of elements that belong to multiple sets simultaneously. This overlap is the key to unlocking the power of Venn diagrams in analyzing and comparing different groups. It allows us to see, at a glance, what characteristics or members are shared between distinct categories.
To better grasp this concept, let's consider the example of soccer and tennis players mentioned in the video. Imagine two circles: one representing soccer players and another representing tennis players. While many individuals might exclusively play one sport or the other, there's a possibility that some athletes enjoy and participate in both soccer and tennis. This is where the magic of overlapping circles comes into play.
The area where these two circles intersect represents those versatile athletes who play both sports. This overlapping region is a visual representation of the subset of individuals who belong to both the "soccer players" set and the "tennis players" set. It's a powerful way to illustrate that these athletes share characteristics of both groups without losing their individual identities within each sport.
The significance of this overlapping area cannot be overstated. It provides immediate insight into the relationships between different sets. In our sports example, the overlap might prompt questions like: What skills do soccer and tennis have in common? How might playing both sports benefit an athlete? Are there training regimens that could be shared between the two disciplines?
Moreover, the size of the overlapping area relative to the individual circles can offer additional insights. A large overlap might suggest that many skills or characteristics are shared between the sets, while a smaller overlap could indicate more distinct, specialized groups with fewer common elements.
Overlapping circles in Venn diagrams are not limited to just two sets. More complex relationships can be illustrated by adding additional circles, creating multiple intersections. This allows for the visualization of intricate relationships between three, four, or even more sets of data. Each new intersection represents a unique combination of shared elements across the sets involved.
The beauty of using overlapping circles to represent multiple sets lies in its simplicity and clarity. Even those unfamiliar with complex mathematical concepts can quickly grasp the relationships being illustrated. This makes Venn diagrams with overlapping circles an invaluable tool in fields ranging from mathematics and logic to business analysis and education.
In essence, the overlapping areas in Venn diagrams serve as bridges between different sets, highlighting commonalities and shared elements. They invite us to explore the nuances of relationships between categories that might otherwise seem distinct or unrelated. By visually representing these intersections, Venn diagrams encourage a deeper understanding of how different groups or concepts interact and overlap in the real world.
Whether you're analyzing customer segments in marketing, exploring biological classifications in science, or simply trying to understand the relationships between different ideas, the concept of overlapping circles in Venn diagrams provides a powerful framework for visualization and analysis. It reminds us that in many cases, categories are not mutually exclusive, and the most interesting insights often lie in the areas where different sets intersect and interact.
Reading and Interpreting Venn Diagrams
Venn diagrams are powerful visual tools used to represent relationships between different sets of data. Learning how to read a Venn diagram is an essential skill for set analysis and data interpretation. This step-by-step guide will help you master the art of interpreting Venn diagrams effectively.
Step 1: Identify the Sets
Begin by identifying the individual sets represented in the diagram. Each set is typically depicted as a circle or oval, often labeled with a descriptive name or letter. For example, you might see Set A for "Dog Owners" and Set B for "Cat Owners."
Step 2: Understand the Universe
The entire space within the rectangular boundary of the diagram represents the universe or the total population being considered. This includes all elements, whether they belong to a specific set or not.
Step 3: Analyze Non-Overlapping Regions
Look at the areas of each circle that don't overlap with others. These regions represent elements that belong exclusively to that set. For instance, in our pet owner example, the non-overlapping part of Set A would represent people who own dogs but not cats.
Step 4: Examine Overlapping Areas
Pay close attention to where circles intersect. These overlapping regions represent elements that belong to multiple sets simultaneously. In a two-set diagram, the overlap shows elements common to both sets. For our example, this would be people who own both dogs and cats.
Step 5: Count Elements in Each Region
If numbers are provided, note how many elements are in each region of the diagram. This includes non-overlapping areas, overlapping sections, and the area outside all sets but within the universe.
Step 6: Calculate Total Set Sizes
To determine the total number of elements in a set, add the number in its exclusive region to the number in any overlapping areas it's part of. For Set A (Dog Owners), this would be the sum of dog-only owners plus dog-and-cat owners.
Step 7: Interpret Relationships
Analyze how the sets relate to each other. Are there large overlaps indicating strong relationships? Or minimal overlaps suggesting distinct groups? This helps in understanding the distribution and connections between different categories.
Step 8: Consider the Complement
The area inside the universe but outside all sets is the complement. It represents elements that don't belong to any of the defined sets. In our example, this might be people who don't own dogs or cats.
Example: Three-Set Venn Diagram
Let's consider a more complex example with three sets: A (Coffee Drinkers), B (Tea Drinkers), and C (Hot Chocolate Drinkers). The diagram would have seven distinct regions:
- Three non-overlapping regions (exclusive to A, B, or C)
- Three double-overlapping regions (AB, BC, AC)
- One triple-overlapping region (ABC)
To find the total number of coffee drinkers, you'd add: A (exclusive) + AB + AC + ABC.
Practical Applications
Venn diagrams are invaluable for various applications:
- Data Analysis: Comparing different data sets or customer segments
- Problem Solving: Identifying common factors or unique elements
- Decision Making: Visualizing pros and cons of different options
- Education: Teaching set theory and logical relationships
By following these steps and practicing with various examples, you'll become proficient in interpreting Venn diagrams. This skill will enhance your ability to analyze complex relationships and make informed decisions based on set analysis. Remember
Drawing Venn Diagrams
Creating Venn diagrams is an essential skill for visualizing relationships between different sets of data. This tutorial will guide you through the process of drawing Venn diagrams, from simple two-circle designs to more complex Venn diagrams representations.
To begin drawing Venn diagrams, follow these steps:
- Choose appropriate circle sizes: The size of each circle should reflect the relative importance or quantity of the set it represents. For equal sets, use circles of the same size.
- Position the circles: Arrange the circles so they overlap clearly, creating distinct sections for shared elements. For a two-circle diagram, aim for about 30-50% overlap.
- Label the circles: Clearly label each circle to identify the set it represents.
- Add elements: Write or draw the elements within their corresponding sections of the diagram.
For a simple two-circle Venn diagram:
- Draw two overlapping circles of equal size on your paper or digital canvas.
- Label each circle with the name of the set it represents.
- In the overlapping area, write elements that are common to both sets.
- In the non-overlapping areas, add elements unique to each set.
Tips for creating effective Venn diagrams:
- Use contrasting colors or patterns to distinguish between different circles and sections.
- Keep the design clean and uncluttered for easy readability.
- Use a consistent font and text size for all labels and elements.
- Consider using digital tools for more precise and easily editable diagrams.
For more complex Venn diagrams with three or more circles:
- Arrange circles in a triangular or more intricate pattern to show multiple overlaps.
- Use different colors or shading to highlight various intersections.
- Consider using software specifically designed for creating Venn diagrams to handle complex relationships.
Remember, the key to a successful Venn diagram is clarity. Whether you're creating a simple two-circle diagram or a more complex multi-circle representation, ensure that the relationships between sets are immediately apparent to the viewer. With practice, you'll become proficient at drawing Venn diagrams that effectively communicate complex information in a visually appealing and easy-to-understand format.
Applications of Venn Diagrams
Venn diagrams, originally developed for mathematical set theory, have found widespread applications across various fields, demonstrating their versatility in problem-solving, data organization, and decision-making. These visual representations of logical relationships between different sets have proven invaluable in numerous real-world scenarios beyond mathematics.
In the realm of logic and critical thinking, Venn diagrams serve as powerful tools for analyzing arguments and identifying logical fallacies. They help visualize the relationships between different premises and conclusions, making it easier to spot inconsistencies or gaps in reasoning. For instance, in evaluating the validity of syllogisms, Venn diagrams can quickly illustrate whether the conclusion logically follows from the given premises.
Statistics and data analysis benefit greatly from Venn diagram applications. Researchers and analysts use these diagrams to represent and analyze complex datasets, particularly when dealing with overlapping categories or attributes. In epidemiology, for example, Venn diagrams can illustrate the distribution of symptoms among different patient groups, helping identify common factors or unique characteristics. Similarly, in market research, they can visualize customer segments based on various demographic or behavioral attributes, aiding in targeted marketing strategies.
The field of computer science extensively utilizes Venn diagrams for various purposes. In database management, they help in understanding and optimizing database queries, especially when dealing with complex joins or set operations. Venn diagrams are also crucial in Boolean algebra and digital logic design, where they represent logical operations and circuit designs. Furthermore, in algorithm design and analysis, these diagrams assist in visualizing the intersection of different algorithmic approaches or data structures, facilitating the development of more efficient solutions.
Business and strategic planning frequently employ Venn diagrams for decision-making and problem-solving. They are particularly useful in competitive analysis, where companies can visualize their unique selling propositions compared to competitors. In project management, Venn diagrams help in resource allocation by illustrating the overlap of skills and responsibilities among team members. Risk assessment in business often utilizes these diagrams to identify areas of vulnerability where multiple risk factors intersect.
In the field of education, Venn diagrams serve as effective teaching tools across various subjects. They help students compare and contrast concepts, characters, or historical events, promoting critical thinking and analytical skills. For language learners, Venn diagrams can illustrate similarities and differences between languages or dialects, aiding in comprehension and retention.
Scientific research benefits from Venn diagram applications in numerous ways. In biology, they are used to represent genetic inheritance patterns or ecological relationships between species. Chemistry employs these diagrams to illustrate molecular structures and chemical reactions. In environmental science, Venn diagrams can depict the complex interactions between different ecosystems or environmental factors.
The versatility of Venn diagrams extends to social sciences as well. Sociologists use them to analyze social group dynamics and cultural intersections. In psychology, they help in understanding personality traits or cognitive processes. Political scientists employ Venn diagrams to illustrate the overlap of ideologies or voter demographics.
In conclusion, the applications of Venn diagrams extend far beyond their mathematical origins. Their ability to visually represent complex relationships makes them invaluable tools for problem-solving, data organization, and decision-making across diverse fields. From business strategy to scientific research, from computer programming to educational pedagogy, Venn diagrams continue to prove their worth as versatile and powerful analytical instruments. As data complexity grows in our increasingly interconnected world, the relevance and utility of Venn diagrams in various real-world applications are likely to expand even further.
Conclusion
Venn diagrams are powerful visual tools for representing relationships between sets. Key points include understanding overlapping regions, exclusive areas, and the universal set. These diagrams are crucial in various fields, from mathematics and logic to business and science. They help simplify complex information, making it easier to analyze and draw conclusions. The importance of Venn diagrams in academic and practical applications cannot be overstated. They enhance critical thinking, problem-solving skills, and data interpretation with Venn diagrams. To truly grasp Venn diagrams, regular practice is essential. Create your own diagrams, interpret existing ones, and apply them to real-world scenarios. This hands-on approach will solidify your understanding and improve your analytical skills. Remember, the introduction video serves as an excellent foundation for mastering Venn diagrams. By combining the video's insights with consistent practice, you'll develop a valuable skill set applicable across numerous disciplines. Embrace Venn diagrams as a versatile tool for organizing and visualizing information effectively.
Example:
Reading Information from Venn Diagrams
In a playground 6 students like to play on the swings and 12 students like to play on the jungle gym. 4 students played on both.
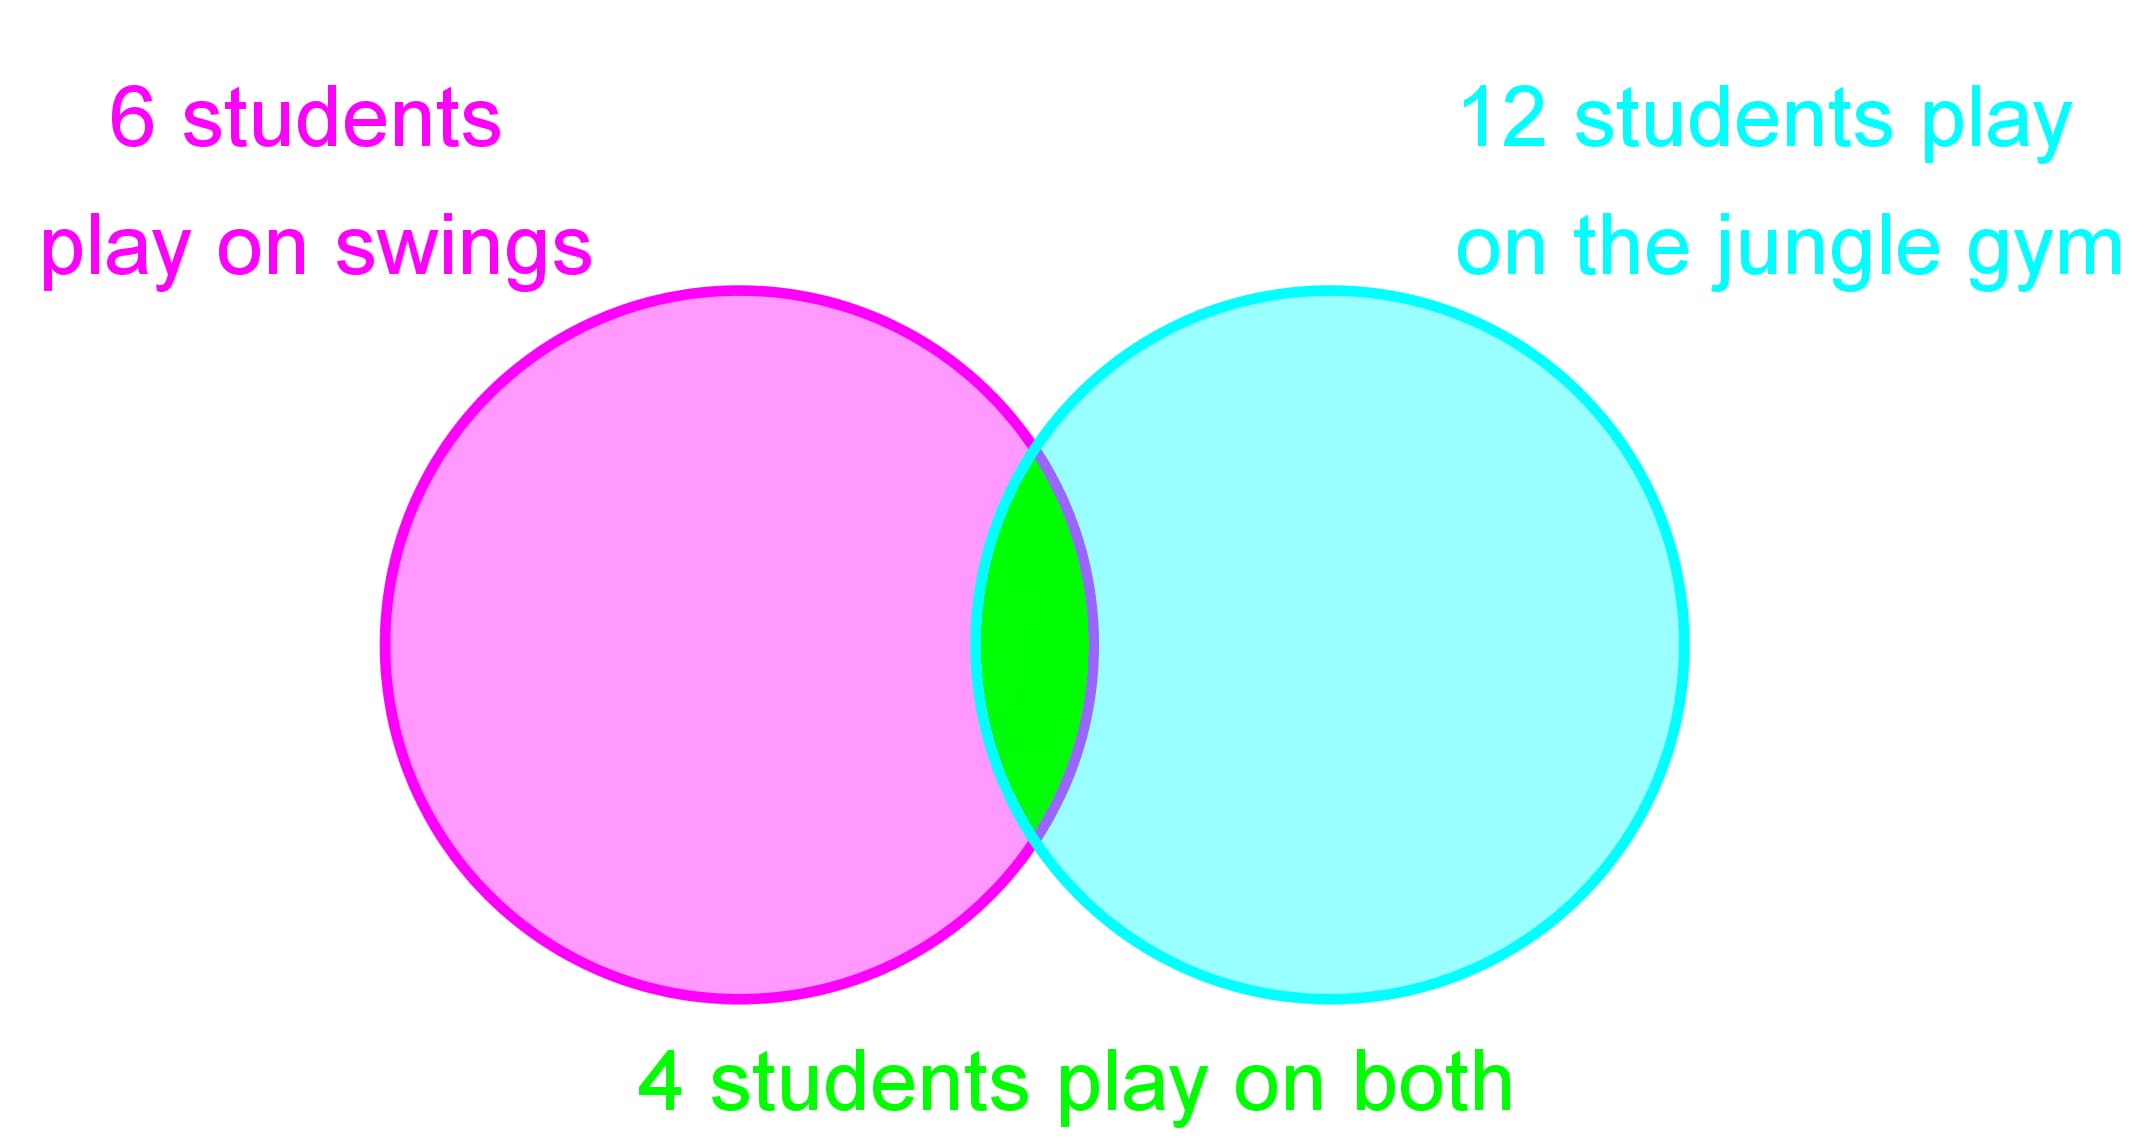
How many students play only on the swings?
Step 1: Understand the Problem
First, we need to understand the problem and the information given. We know that there are 6 students who like to play on the swings, 12 students who like to play on the jungle gym, and 4 students who play on both. The question asks us to find out how many students play only on the swings.
Step 2: Identify the Total Number of Students in Each Category
We need to identify the total number of students in each category. The total number of students who play on the swings is 6, and the total number of students who play on the jungle gym is 12. However, 4 students play on both the swings and the jungle gym. This overlap is crucial for solving the problem.
Step 3: Visualize the Venn Diagram
Visualizing the Venn diagram can help us understand the distribution of students. In the Venn diagram, one circle represents students who play on the swings, and the other circle represents students who play on the jungle gym. The overlapping area represents students who play on both.
Step 4: Calculate the Number of Students Playing Only on the Swings
To find the number of students who play only on the swings, we need to subtract the number of students who play on both from the total number of students who play on the swings. This can be calculated as follows:
Number of students playing only on the swings = Total students on swings - Students playing on both
Using the given numbers:
Number of students playing only on the swings = 6 - 4
Step 5: Verify the Calculation
It's important to verify our calculation to ensure accuracy. We calculated that 2 students play only on the swings. To verify, we can add the number of students playing only on the swings and the number of students playing on both:
Total students on swings = Students playing only on swings + Students playing on both
Using the calculated numbers:
6 = 2 + 4
This confirms that our calculation is correct.
Step 6: Conclusion
In conclusion, by understanding the problem, identifying the total number of students in each category, visualizing the Venn diagram, calculating the number of students playing only on the swings, and verifying our calculation, we can determine that 2 students play only on the swings.
FAQs
Here are some frequently asked questions about Venn diagrams:
1. What Is a Venn Diagram?
A Venn diagram is a visual representation of the relationships between different sets of data. It uses overlapping circles or other shapes to show how elements in different sets are related, including commonalities and differences.
2. How do you interpret a Venn diagram?
To interpret a Venn diagram, start by identifying the sets represented by each circle. Look at the overlapping areas to see elements shared between sets. Non-overlapping areas represent elements unique to each set. The area outside all circles but within the rectangle (if present) represents elements not in any set.
3. What does and mean in math?
In set theory and Venn diagrams, represents intersection (elements common to two or more sets), while represents union (all elements in either set). For example, A B means elements in both A and B, while A B means elements in A or B or both.
4. How do you read a Venn diagram notation?
Venn diagram notation uses symbols to represent set operations. For example, A' means the complement of A (elements not in A), A B represents the intersection of A and B, and A B represents their union. Numbers in each region indicate the count of elements in that specific area.
5. How to read a Venn diagram with two circles?
In a two-circle Venn diagram, each circle represents a set. The overlapping area shows elements common to both sets. Areas outside the overlap but within a circle contain elements unique to that set. The region outside both circles (if within a rectangle) represents elements not in either set.
Prerequisite Topics
Understanding the foundation of any subject is crucial for mastering more complex concepts. When it comes to reading and drawing Venn diagrams, two key prerequisite topics play a vital role in building a solid understanding. These topics are the relationship between two variables and probability with Venn diagrams.
The concept of relationships between sets is fundamental to grasping Venn diagrams. By understanding how variables interact and relate to each other, students can better interpret the information presented in these visual representations. The relationship between two variables forms the basis for creating and analyzing Venn diagrams, as these diagrams essentially illustrate the connections and overlaps between different sets or groups.
When students have a strong grasp of how variables relate, they can more easily identify patterns and relationships within Venn diagrams. This knowledge allows them to quickly recognize intersections, unions, and complements of sets, which are core components of Venn diagram analysis. Moreover, understanding these relationships helps in interpreting real-world scenarios represented by Venn diagrams, making the concept more applicable and relevant.
Another crucial prerequisite topic is probability with Venn diagrams. This concept bridges the gap between basic set theory and more advanced applications of Venn diagrams in statistics and data analysis. By understanding how probability relates to the areas within a Venn diagram, students can solve complex problems involving overlapping events or characteristics.
The ability to calculate probabilities using Venn diagrams is an essential skill that builds upon the foundation of creating Venn diagrams. It allows students to quantify the likelihood of events occurring within different sets or combinations of sets. This knowledge is particularly valuable in fields such as data science, market research, and risk assessment, where understanding the probability of various outcomes is crucial.
By mastering these prerequisite topics, students will find themselves well-equipped to tackle more advanced concepts in reading and drawing Venn diagrams. They will be able to create accurate representations of complex relationships, interpret intricate diagrams with ease, and apply their knowledge to solve real-world problems. The skills gained from studying the relationship between two variables and probability with Venn diagrams serve as building blocks for a deeper understanding of set theory, logic, and statistical analysis.
In conclusion, investing time in thoroughly understanding these prerequisite topics will pay dividends as students progress in their study of Venn diagrams. It will not only make the learning process smoother but also enhance their ability to apply this knowledge in various academic and professional contexts. By recognizing the importance of these foundational concepts, students can build a strong framework for success in mathematics, statistics, and related fields.