Overview
Watch
Read
Next Steps
Read
How to Approximate Derivatives from Tables: A Comprehensive Guide
In this article, we've explored the essential skill of estimating derivatives from tables, a crucial concept in calculus. We began with an introduction video that laid the foundation for understanding this process. Key points covered include the definition of derivatives, the importance of rate of change, and step-by-step methods for estimating derivatives using tabular data. The introduction video played a vital role in visualizing these concepts, making them more accessible to learners. To truly master derivative estimation, practice is key. We encourage readers to work through various examples, starting with simple linear functions and progressing to more complex scenarios. For further study, consider exploring online calculus resources, textbooks, or seeking guidance from math tutors. Remember, mastering derivative estimation from tables not only enhances your calculus skills but also provides valuable insights into real-world applications of rate of change. Keep practicing, and you'll soon find yourself confidently tackling even the most challenging derivative estimation problems.
Estimating Derivatives
Estimating Derivatives
Use the table below to estimate the following derivatives as accurately as possible:
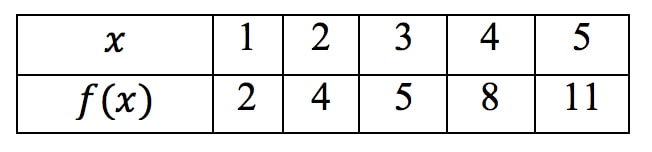
\(f'(1)\)
Step 1: Understanding the Problem
The first step in estimating the derivative \(f'(1)\) is to understand what the problem is asking. We are given a table of values and asked to estimate the derivative at \(x = 1\). The derivative, \(f'(1)\), represents the slope of the function \(f(x)\) at \(x = 1\). Therefore, our goal is to estimate the slope of the function at this specific point using the given table of values.
Step 2: Identifying the Relevant Points
To estimate the slope at \(x = 1\), we need to identify two points from the table that are close to \(x = 1\). The table provides us with the values of \(f(x)\) at different points. Specifically, we need to find the points \((x_1, f(x_1))\) and \((x_2, f(x_2))\) that are closest to \(x = 1\). From the table, we can see that the points \((1, 2)\) and \((2, 4)\) are the closest to \(x = 1\).
Step 3: Applying the Slope Formula
Once we have identified the relevant points, we can use the slope formula to estimate the derivative. The slope formula is given by:
\( m = \frac{f(x_2) - f(x_1)}{x_2 - x_1} \)
In this case, our points are \((x_1, f(x_1)) = (1, 2)\) and \((x_2, f(x_2)) = (2, 4)\). Plugging these values into the slope formula, we get:
\( m = \frac{4 - 2}{2 - 1} \)
Step 4: Calculating the Slope
Now, we perform the calculation to find the slope:
\( m = \frac{4 - 2}{2 - 1} = \frac{2}{1} = 2 \)
This calculation gives us the estimated slope at \(x = 1\), which is the value of the derivative \(f'(1)\).
Step 5: Verifying the Accuracy
Finally, we need to consider the accuracy of our estimate. Since \(x = 1\) is the first point in the table and the closest point we used is \(x = 2\), our estimate is as accurate as possible given the available data. However, if more points were available closer to \(x = 1\), we could potentially get a more accurate estimate.
Conclusion
By following these steps, we have successfully estimated the derivative \(f'(1)\) using the given table of values. The key steps involved understanding the problem, identifying the relevant points, applying the slope formula, calculating the slope, and verifying the accuracy of our estimate.
FAQs
-
How to Estimate the Derivative of a Function at a Point Based on a Table?
To estimate the derivative of a function at a point using a table, follow these steps:
- Identify two points in the table closest to the point of interest.
- Calculate the change in y (Δy) and change in x (Δx) between these points.
- Use the formula: Estimated derivative Δy / Δx
- The result approximates the derivative at the midpoint between the two chosen points.
-
How to approximate a derivative given a table?
To approximate a derivative from a table:
- Select two adjacent points from the table.
- Calculate the difference in y-values (Δy) and x-values (Δx).
- Divide Δy by Δx to get the average rate of change.
- This average rate of change approximates the derivative at the midpoint between the chosen points.
-
How to estimate second derivative from table?
To estimate the second derivative from a table:
- First, estimate the first derivative at multiple points using the method described above.
- Create a new table with these estimated first derivatives.
- Apply the same process to this new table to estimate the second derivative.
- The result approximates the rate of change of the first derivative, which is the second derivative.
-
How do you estimate the derivative of a function?
To estimate the derivative of a function:
- If given a table, use the method described in the first FAQ.
- If given an equation, use the definition of derivative: f'(x) (f(x + h) - f(x)) / h, where h is a small number.
- For better accuracy, use the central difference formula: f'(x) (f(x + h) - f(x - h)) / (2h)
- Always choose h to be as small as possible while avoiding rounding errors.
-
How to estimate a derivative from a graph?
To estimate a derivative from a graph:
- Draw a tangent line to the curve at the point of interest.
- Choose two points on this tangent line.
- Calculate the slope of the tangent line using these points.
- This slope approximates the derivative at the point of tangency.
- For better accuracy, choose points close to the point of interest.
Prerequisite Topics
Understanding the prerequisite topics is crucial when delving into the concept of estimating derivatives from a table. These foundational concepts provide the necessary framework to grasp the intricacies of derivative estimation. One of the most fundamental prerequisites is the slope formula, which forms the basis for understanding how rates of change are calculated. This concept directly relates to the instantaneous rate of change, which is essentially what a derivative represents.
The ability to interpret and work with linear function slope equations is vital, as it helps in visualizing how changes in one variable affect another. This skill is particularly useful when analyzing data presented in tabular form. Additionally, familiarity with the difference quotient formula is essential, as it serves as a precursor to understanding how derivatives are approximated using finite differences.
While linear functions form the foundation, knowledge of more complex functions is also beneficial. Understanding the quadratic function in general form provides insight into non-linear relationships, which is crucial when dealing with real-world data that often exhibits non-linear behavior. Furthermore, familiarity with advanced concepts such as the derivative of inverse trigonometric functions and the logarithmic function derivative can enhance one's ability to estimate derivatives in various contexts.
The relationship between two variables is a fundamental concept that underpins the entire process of estimating derivatives from a table. It allows students to interpret the data and understand how changes in one variable correspond to changes in another. This understanding is further reinforced through the study of applications of linear relations, which demonstrate how these concepts are applied in real-world scenarios.
By mastering these prerequisite topics, students will be well-equipped to tackle the challenge of estimating derivatives from a table. They will have the necessary tools to interpret data, calculate rates of change, and understand the underlying principles that govern the behavior of functions. This comprehensive foundation ensures that students can approach the task of derivative estimation with confidence and a deep understanding of the mathematical concepts at play.