Reading and drawing line graphs
0/2
Intros
Lessons
0/7
Examples
Lessons
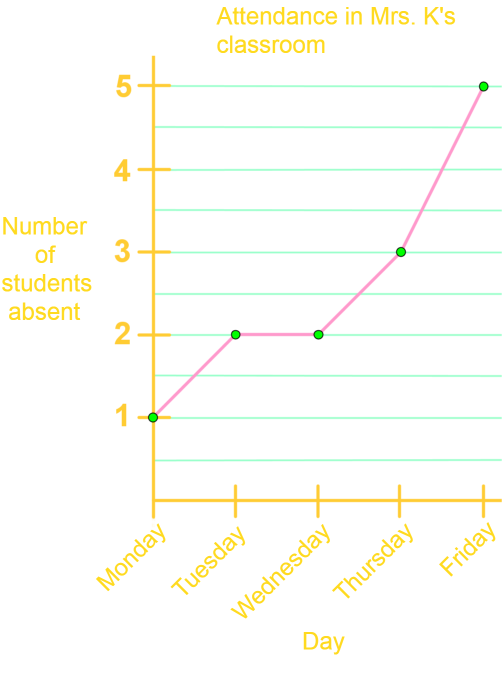
- Mrs. K created a graph to keep track of attendance in her classroom over a week.
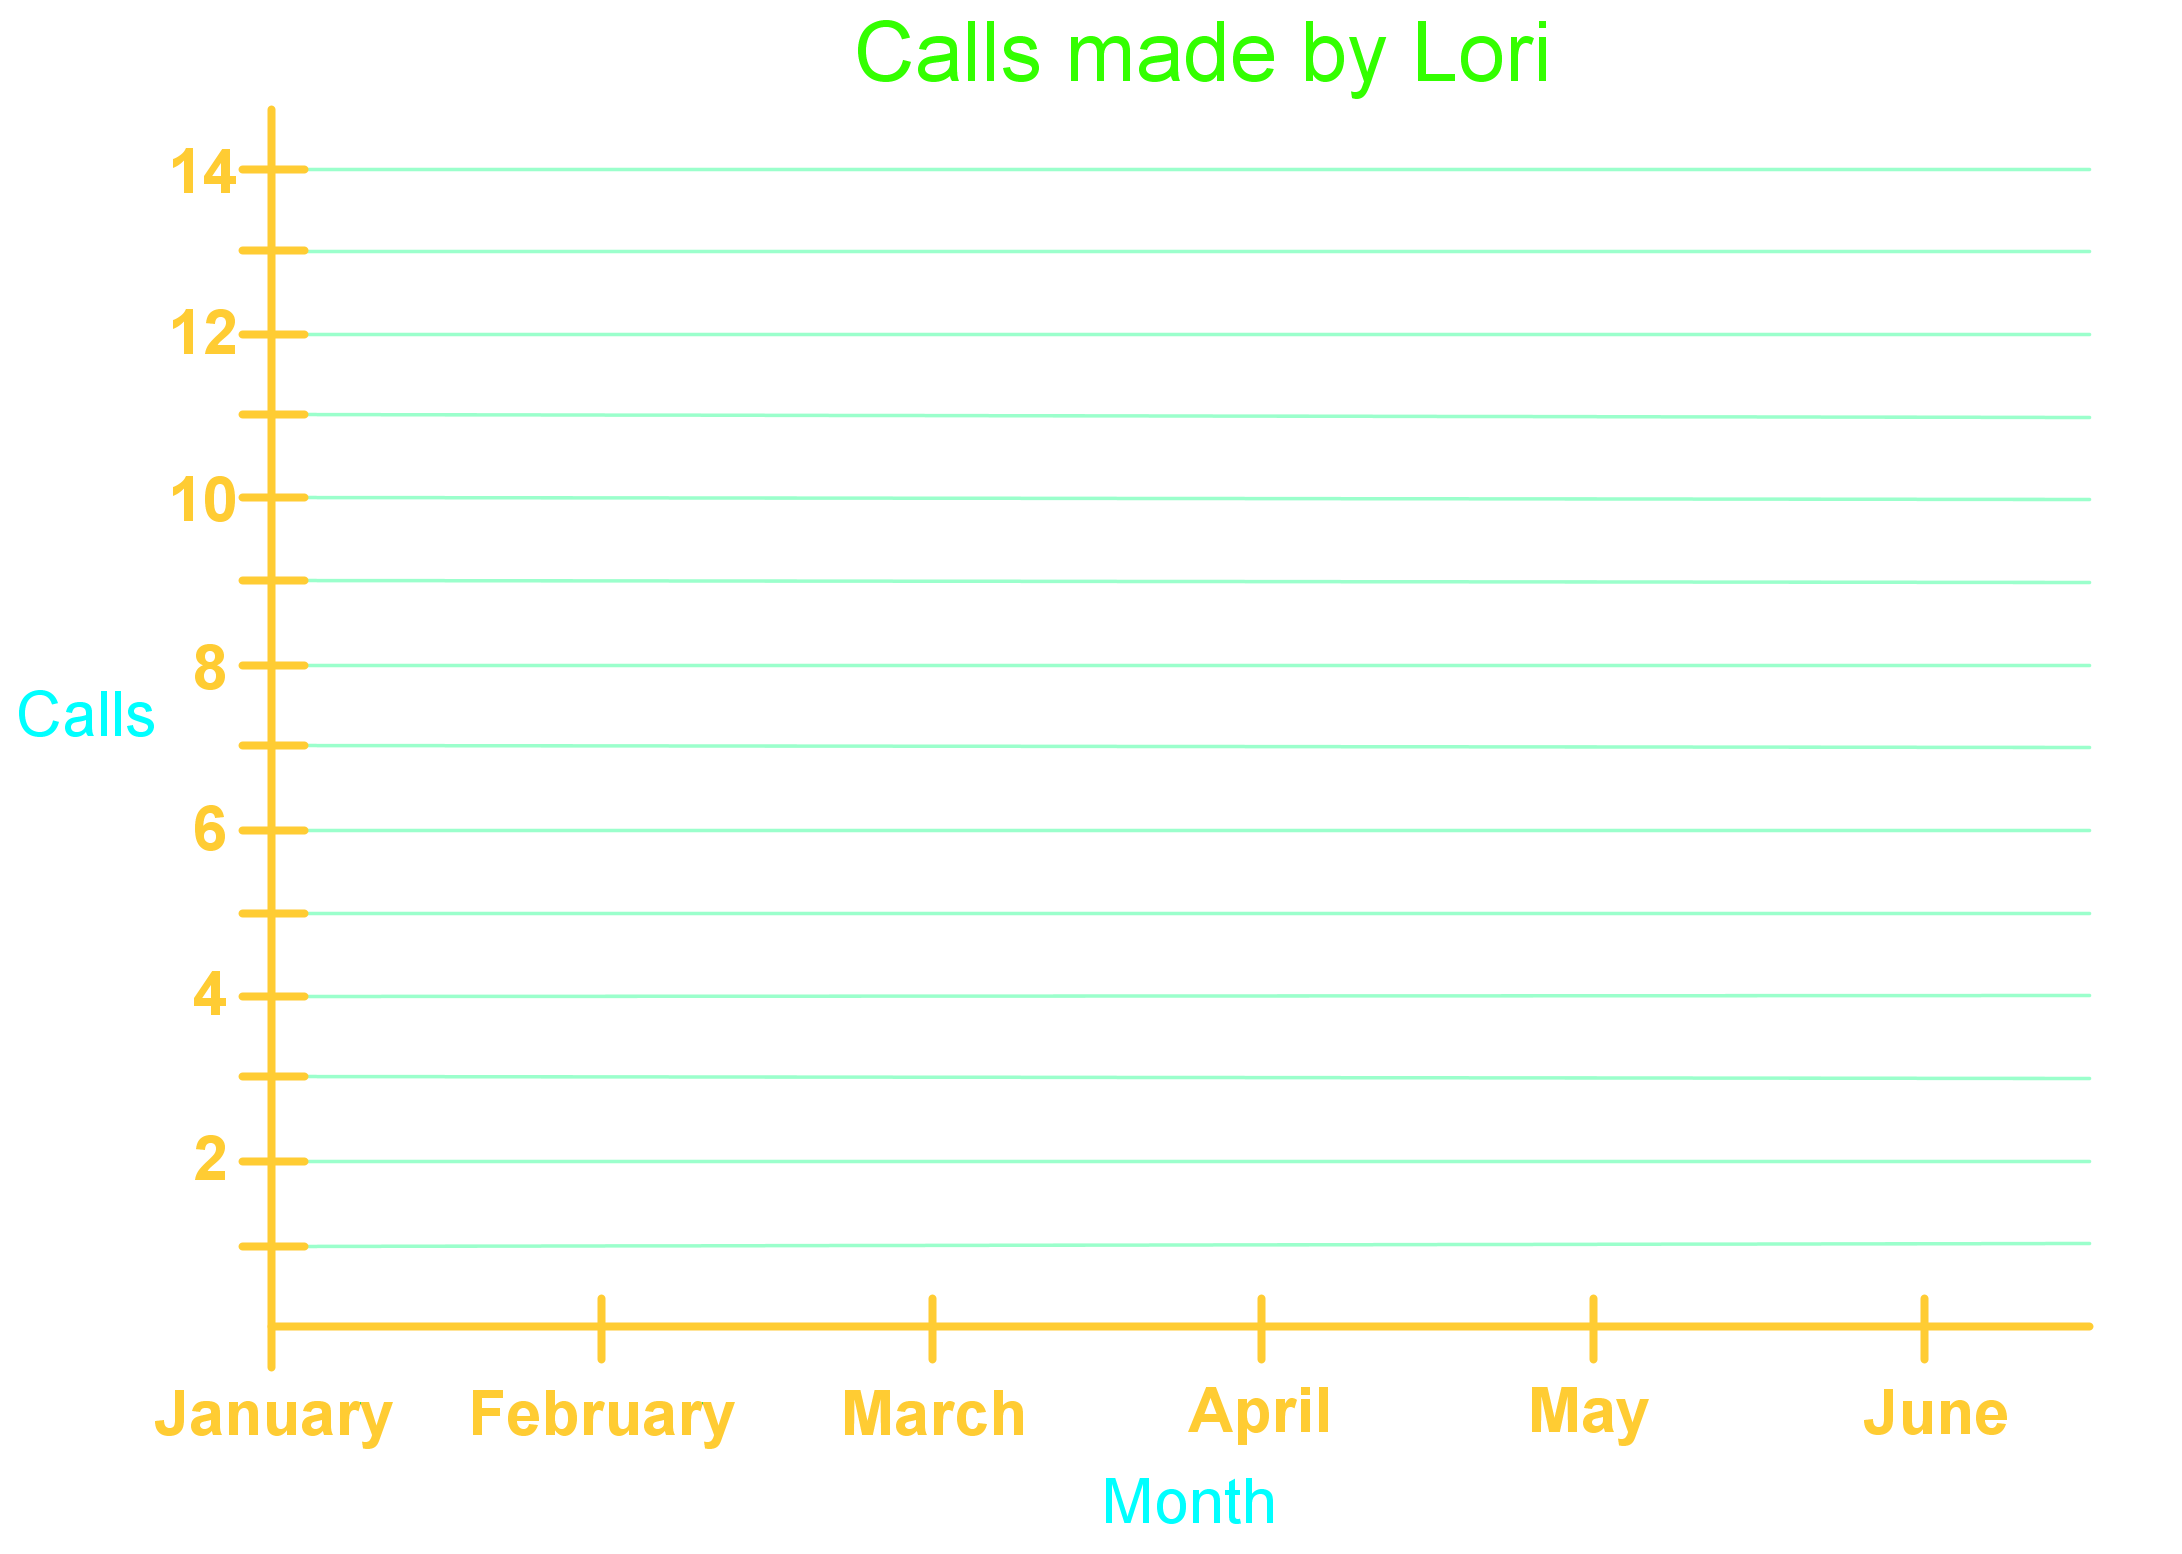
- Lori kept track of the number of long distance calls she made over a 6 month period.
Calls made by Lori:
Month
Calls
January
10
February
5
March
8
April
6
May
4
June
3
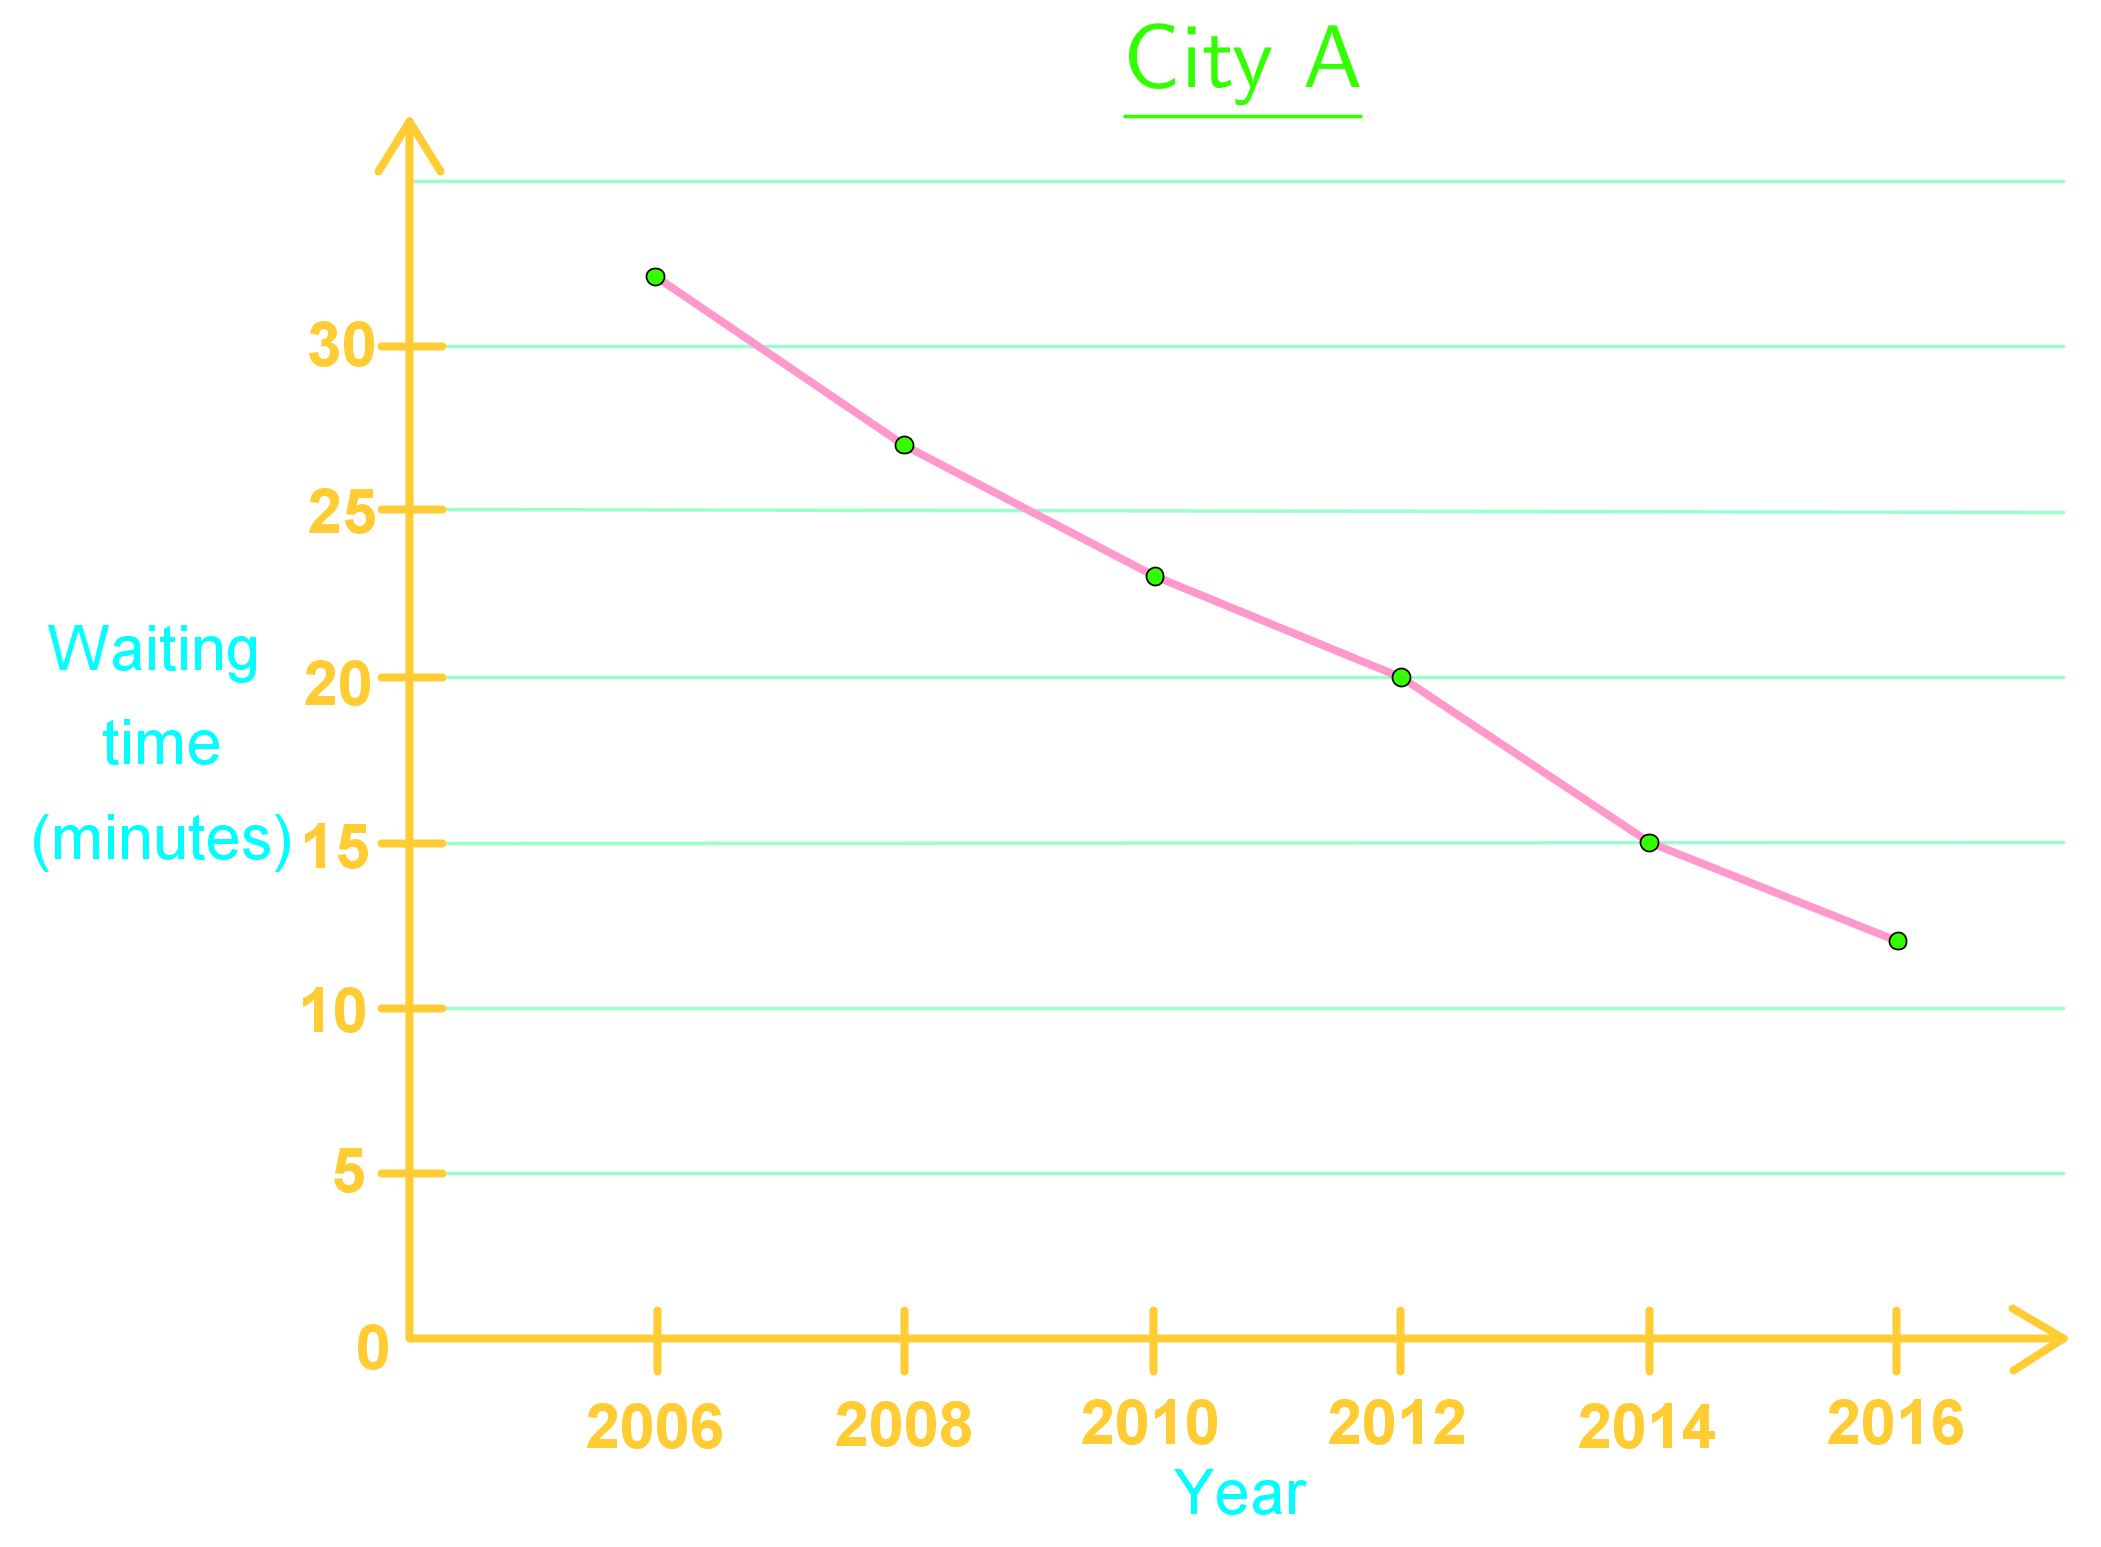
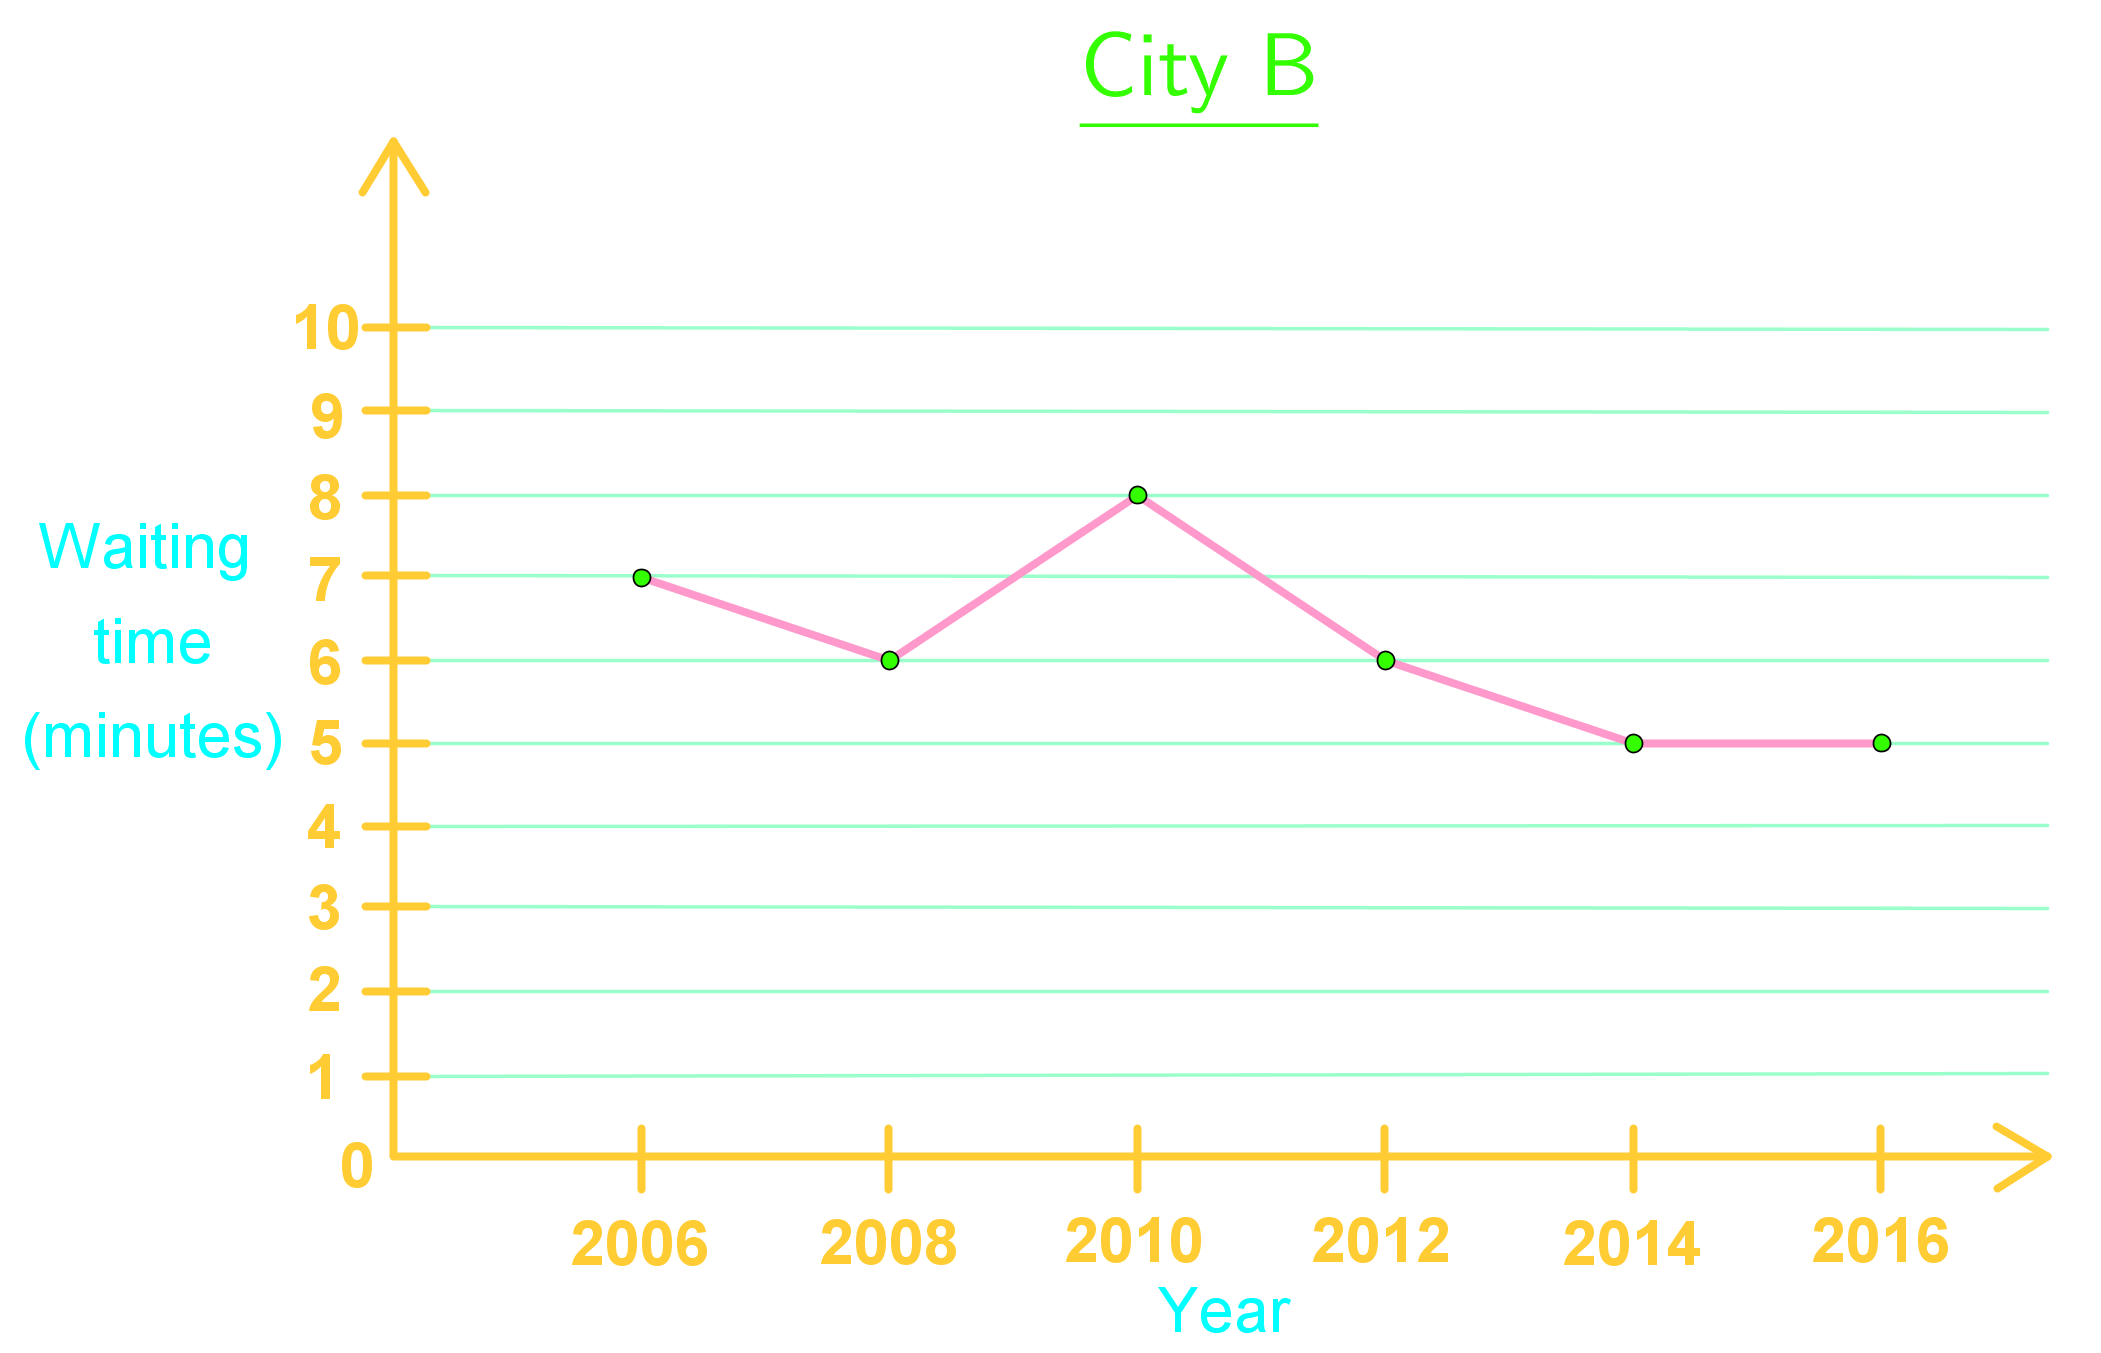
- The governments of two cities claim that they have done a very successful job in developing the public transit system over the past 10 years. Below are line graphs showing the average waiting times for a bus in the two cities in the past 10 years.