TOPIC
Organizing data using Carroll diagramsMY PROGRESS
Pug Score
0%
Getting Started
"Let's build your foundation!"
Best Streak
0 in a row
Study Points
+0
Overview
Practice
Watch
Read
Quiz
Next Steps
Get Started
Get unlimited access to all videos, practice problems, and study tools.
Back to Menu
Topic Progress
Pug Score
0%
Getting Started
"Let's build your foundation!"
Videos Watched
0/0
Best Practice
No score
Read
Not viewed
Best Quiz
No attempts
Best Streak
0 in a row
Study Points
+0
Overview
Practice
Watch
Read
Quiz
Next Steps
Read
Mastering Carroll Diagrams: The Ultimate Guide to Data Organization
In this lesson, we will learn:
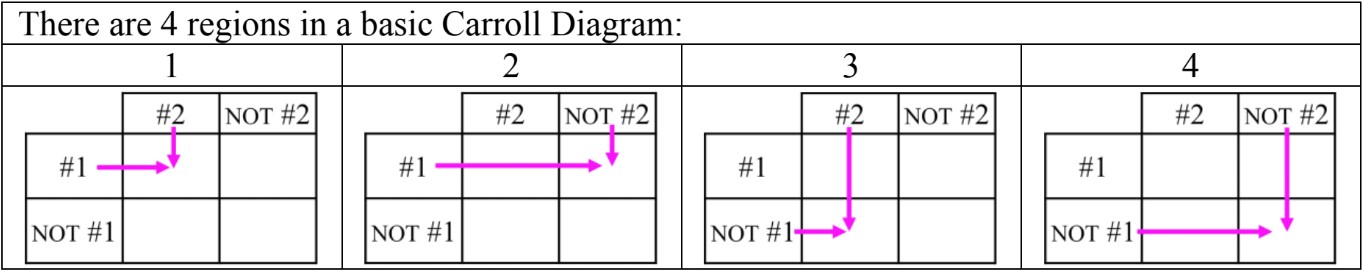
- What the regions of the Carroll Diagram mean in order to sort objects by their attributes
- The similarities and differences between the Carroll Diagram and Venn Diagram
- How to describe pairs of opposite attributes
Notes:
- Carroll Diagrams organize data in a table combining yes-or-no attributes
- i.e. attribute #1 (yes) and NOT attribute #1 (no)
- Sorting Data with Carroll Diagrams is similar to Venn Diagrams
- Venn diagrams use circles to group what belongs or does not belong
- Carroll diagrams use the column (vertical) and row (horizontal) of boxes
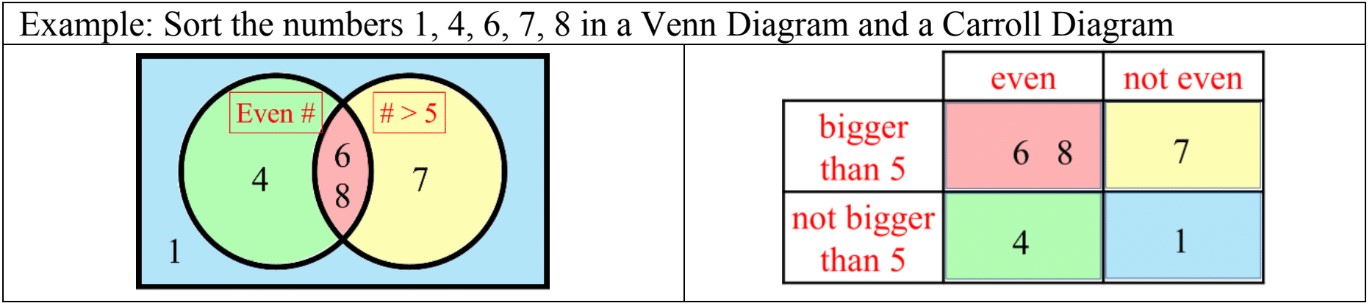
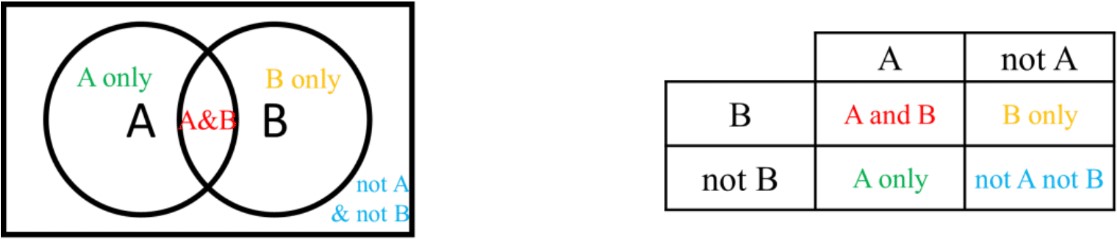
- The regions in a Carroll Diagram and Venn Diagram are the same:
- Some examples for pairs of opposite yes-or-no attributes:
- "even number" and "not even number" (odd)
- "odd number" and "not odd number" (even"
- "less than 10" and "not less than 10" (10 or more)
- "more than 5" and "not more than 5" (5 or less)
Introduction to Carroll Diagrams
Carroll diagrams are powerful tools for organizing and visualizing data in a structured manner. Named after Lewis Carroll, these diagrams provide a clear and efficient way to classify information based on specific attributes. Our introduction video offers a comprehensive overview of Carroll diagrams and their applications. The primary purpose of these diagrams is to sort data into distinct categories, making it easier to analyze and draw conclusions. As you explore Carroll diagrams, you'll focus on three main learning objectives. First, you'll gain a deep understanding of the different regions within the diagram and how they represent various data categories. Second, you'll compare Carroll diagrams with Venn diagrams, noting their similarities and differences in data representation. Lastly, you'll learn to describe opposite attributes, a key feature of Carroll diagrams that allows for comprehensive data classification. By mastering these concepts, you'll enhance your ability to organize and interpret complex information effectively.
Understanding Carroll Diagram Regions
Carroll diagrams are powerful visual tools used to sort and classify objects based on specific attributes. The regions of a Carroll diagram represent distinct categories created by the intersection of two or more attributes, each with a yes-no format. Understanding these regions is crucial for effectively using and interpreting Carroll diagrams in various fields, from mathematics to data analysis.
In a typical Carroll diagram, the regions are formed by dividing a rectangular space into sections based on the chosen attributes. Each attribute is represented by a label on the top or left side of the diagram, creating a grid-like structure. The resulting regions correspond to the possible combinations of these attributes, allowing for a clear and systematic organization of objects or data points.
To illustrate how objects are sorted by their attributes in a Carroll diagram, let's consider an example from the video. Imagine we're categorizing animals based on two attributes: "Has fur" and "Can fly." The Carroll diagram would have four distinct regions:
- Region 1: Has fur and can fly (e.g., bats)
- Region 2: Has fur but cannot fly (e.g., cats, dogs)
- Region 3: Does not have fur but can fly (e.g., birds)
- Region 4: Does not have fur and cannot fly (e.g., fish, reptiles)
Each animal would be placed in the appropriate region based on its characteristics, providing a clear visual representation of how these attributes are distributed among different species.
The regions in a Carroll diagram differ from those in a Venn diagram in several key aspects. While Venn diagrams use overlapping circles to show relationships between sets, Carroll diagrams employ a grid structure with clearly defined boundaries. The yes-no format of Carroll diagrams is particularly distinctive, as it allows for a more straightforward classification of objects based on the presence or absence of specific attributes.
This yes-no format is one of the strengths of Carroll diagrams. Each region represents a unique combination of "yes" or "no" responses to the attributes in question. This binary approach simplifies the classification process and makes it easier to identify patterns or gaps in the data.
Interpreting the intersecting labels in a Carroll diagram is crucial for understanding the significance of each region. The labels typically appear along the top and left sides of the diagram, with each label representing a specific attribute. The intersection of these labels defines the characteristics of the objects that belong in each region.
For example, in our animal classification diagram, the region where "Has fur - Yes" intersects with "Can fly - Yes" would contain animals that possess both of these attributes. By following the labels, users can quickly determine the defining characteristics of objects in any given region.
Carroll diagrams are particularly useful when dealing with multiple attributes. As more attributes are added, the diagram expands to accommodate additional combinations, creating a multi-dimensional classification system. This scalability makes Carroll diagrams valuable tools for complex data analysis and decision-making processes.
In conclusion, the regions of a Carroll diagram represent distinct categories based on the presence or absence of specific attributes. By utilizing a yes-no format and clearly defined intersecting labels, Carroll diagrams offer a structured and intuitive approach to sorting and analyzing data. Understanding these regions and how they relate to the chosen attributes is essential for effectively leveraging Carroll diagrams in various applications, from educational settings to professional data analysis.
Comparing Carroll Diagrams and Venn Diagrams
Carroll diagrams and Venn diagrams are both powerful tools for data representation and sorting, but they have distinct characteristics that make them suitable for different scenarios. Understanding the similarities and differences between these two diagram types can help you choose the most effective method for visualizing and analyzing your data.
Similarities between Carroll diagrams and Venn diagrams:
- Both use attributes to sort and categorize data
- They provide visual representations of data relationships
- Both can be used to organize and classify information
- They help in identifying patterns and connections within data sets
Differences in presentation and structure:
- Carroll diagrams use a grid-like structure with rows and columns
- Venn diagrams utilize overlapping circles or shapes
- Carroll diagrams are better for binary attributes (yes/no, true/false)
- Venn diagrams excel at showing relationships between multiple sets
To illustrate how the same data can be represented in both diagram types, let's consider an example from the video. Imagine we have a set of animals with attributes such as "has fur" and "can fly." In a Carroll diagram, we would create a 2x2 grid with these attributes as headers for rows and columns. Each cell would then contain animals that fit the corresponding criteria.
For instance:
- Cell 1 (Has fur, Can fly): Bats
- Cell 2 (Has fur, Cannot fly): Cats, dogs
- Cell 3 (No fur, Can fly): Birds, insects
- Cell 4 (No fur, Cannot fly): Fish, reptiles
In contrast, a Venn diagram for the same data would consist of two overlapping circles. One circle would represent "has fur," while the other would represent "can fly." The overlapping area would contain animals that possess both attributes (bats). The non-overlapping areas would contain animals with only one attribute or neither attribute.
Advantages of Carroll diagrams:
- Clear and structured presentation of binary attributes
- Easy to read and interpret for simple classifications
- Efficient for sorting large amounts of data into distinct categories
- Ideal for comparing and contrasting items based on specific criteria
Advantages of Venn diagrams:
- Visually appealing and intuitive for showing relationships
- Effective for displaying overlapping sets and commonalities
- Flexible in accommodating multiple sets (up to 3-4 comfortably)
- Useful for illustrating complex relationships and intersections
When choosing between Carroll diagrams and Venn diagrams, consider the nature of your data and the relationships you want to highlight. Carroll diagrams are particularly useful for data sets with clear binary attributes and when you need to sort items into distinct categories. They excel in situations where you want to compare and contrast items based on specific criteria.
On the other hand, Venn diagrams are more suitable for showcasing relationships between multiple sets, especially when there are overlapping elements. They are visually intuitive and can effectively illustrate commonalities and differences between groups. Venn diagrams are particularly powerful when dealing with complex relationships that involve multiple attributes or categories.
In conclusion, both Carroll diagrams and Venn diagrams are valuable tools for data representation and sorting. By understanding their strengths and limitations, you can choose the most appropriate diagram type to effectively visualize and analyze your data. Whether you opt for the structured grid of a Carroll diagram or the overlapping circles of a Venn diagram, these visual aids can greatly enhance your ability to interpret and communicate complex information.
Describing Pairs of Opposite Attributes
Carroll diagrams are powerful tools for organizing and analyzing data, and a key concept in their construction is the use of opposite attributes. These attribute pairs create distinct categories that allow for clear classification of data points. Understanding how to identify and describe opposite attributes is crucial for effectively utilizing Carroll diagrams in various contexts.
Opposite attributes are characteristics that are mutually exclusive and collectively exhaustive. This means that any given data point must belong to one category or the other, with no overlap or ambiguity. In a 2x2 Carroll diagram, two pairs of opposite attributes are used to create four distinct regions, each representing a unique combination of these attributes.
One common example of opposite attributes is "even and odd numbers" (which is equivalent to "odd") when dealing with numbers. Every integer must be either even or odd, with no exceptions. This pair of attributes creates a clear division in a data set of numbers. Another example is "less than 10" and "not less than 10" (which includes numbers equal to or greater than 10). These attribute pairs demonstrate how opposite characteristics can be used to categorize data effectively.
When identifying opposite attributes for a Carroll diagram, it's important to consider the nature of the data set and the specific characteristics you want to analyze. For numerical data, opposites often involve comparisons (e.g., "greater than" vs. "less than or equal to") or properties (e.g., "prime" vs. "not prime"). For categorical data, opposites might involve the presence or absence of a specific trait (e.g., "has wings" vs. "does not have wings" for a set of animals).
To describe opposite attributes effectively, use clear and unambiguous language. Ensure that the attributes are truly mutually exclusive and that every data point in your set can be classified into one category or the other. It's often helpful to phrase one attribute positively and the other as its negation (e.g., "has property X" and "does not have property X") to ensure complete coverage of all possibilities.
When creating a Carroll diagram with two pairs of opposite attributes, consider how these pairs interact to create meaningful categories. For example, combining "even and odd numbers" with "less than 10" vs. "not less than 10" creates four distinct regions: even numbers less than 10, odd numbers less than 10, even numbers not less than 10, and odd numbers not less than 10. This structure allows for a comprehensive analysis of the data set based on these characteristics.
It's important to note that the choice of opposite attributes can significantly impact the insights gained from a Carroll diagram. Select attributes that are relevant to your analysis and that provide meaningful distinctions within your data set. Sometimes, it may be necessary to refine your attribute pairs to ensure they are truly opposite and provide valuable categorization.
In conclusion, understanding and effectively using opposite attributes is essential for creating informative Carroll diagrams. By carefully selecting and describing these attribute pairs, you can create a powerful framework for analyzing and presenting data across various domains. Whether you're working with numerical, categorical, or mixed data types, the concept of opposite attributes provides a versatile approach to data organization and analysis.
Creating and Interpreting Carroll Diagrams
Carroll diagrams are powerful visual tools for organizing data with Carroll diagrams based on specific attributes. This step-by-step guide will walk you through the process of creating a Carroll diagram using the example from the video, while also providing tips on how to interpret the resulting information.
Step 1: Choose Appropriate Attributes
The first step in creating a Carroll diagram is selecting the attributes you want to analyze. In our example, we'll use two attributes: "Has Wings" and "Lives in Water." These attributes should be binary, meaning they can be answered with a simple yes or no.
Step 2: Create the Diagram Structure
Draw a large rectangle and divide it into four equal sections. This will create a 2x2 grid, representing the possible combinations of your chosen attributes.
Step 3: Label the Diagram
Label the top of the diagram with your first attribute ("Has Wings") and the left side with your second attribute ("Lives in Water"). Add "Yes" and "No" labels for each attribute along the edges of the diagram.
Step 4: Define the Regions
Each of the four sections in your Carroll diagram now represents a specific combination of attributes:
- Top-left: Has wings and lives in water
- Top-right: Has wings but doesn't live in water
- Bottom-left: Doesn't have wings but lives in water
- Bottom-right: Doesn't have wings and doesn't live in water
Step 5: Sort Data Points
Now it's time to populate your diagram with data points. In our example, we'll use various animals. Consider each animal and determine which section it belongs in based on its attributes. For instance:
- Duck: Has wings and lives in water (top-left)
- Eagle: Has wings but doesn't live in water (top-right)
- Fish: Doesn't have wings but lives in water (bottom-left)
- Cat: Doesn't have wings and doesn't live in water (bottom-right)
Step 6: Add Data to the Diagram
Write each data point (animal) in its corresponding section of the Carroll diagram. Continue this process until you've sorted all your data points.
Interpreting Carroll Diagrams
Once you've created your Carroll diagram, it's essential to understand how to interpret the information it presents:
1. Understanding Each Region
Each section of the diagram represents a unique combination of attributes. By looking at a specific region, you can quickly identify which data points share those particular characteristics.
2. Reading Intersecting Categories
The power of Carroll diagrams lies in their ability to show relationships between different attributes. By examining how data points are distributed across the sections, you can identify patterns and correlations between the chosen attributes.
3. Analyzing Distribution
Take note of how your data points are spread across the diagram. Are some sections more populated than others? This can reveal interesting insights about the relationships between your chosen attributes.
4. Identifying Outliers
Carroll diagrams can help you spot unusual or unexpected data points. For example, if you find an animal in the "has wings and lives in water" section that you didn't expect, it might prompt further investigation.
5. Comparing Subsets
You can use the diagram to compare different subsets of your data. For instance, you can easily see how many animals have wings compared to those that don't, or how many water-dwelling creatures there are in total.
Tips for Effective Carroll Diagrams
Practical Applications of Carroll Diagrams
Carroll diagrams, named after Lewis Carroll, are powerful data visualization tools with numerous real-world applications in mathematics and beyond. These versatile diagrams offer a structured approach to organizing and analyzing data, making them invaluable in various fields. Let's explore some practical applications and scenarios where Carroll diagrams shine as effective mathematical tools for data analysis.
In education, Carroll diagrams are widely used to teach set theory and logical reasoning. Teachers employ these diagrams to help students categorize objects or concepts based on specific attributes. For instance, in a biology class, students might use a Carroll diagram to classify animals according to their characteristics, such as whether they are warm-blooded or cold-blooded, and whether they lay eggs or give birth to live young. This visual representation helps learners understand complex relationships and develop critical thinking skills.
The business world also benefits from Carroll diagrams as a data visualization method. Marketing teams can use these diagrams to segment customers based on demographics and purchasing behaviors. For example, a retail company might create a Carroll diagram to categorize customers by age group (young/old) and shopping frequency (frequent/infrequent). This analysis can reveal valuable insights for targeted marketing campaigns and product development strategies.
In the field of quality control, Carroll diagrams prove useful for identifying and addressing manufacturing issues. Engineers can use these diagrams to classify defects in products based on multiple criteria, such as the type of defect and the production stage where it occurred. This systematic approach helps pinpoint areas for improvement in the manufacturing process and enhances overall product quality.
Data scientists and researchers often turn to Carroll diagrams when dealing with complex datasets. These diagrams excel at visualizing multidimensional data, making them particularly effective for exploratory data analysis. For instance, in a study on factors influencing academic performance, researchers might use a Carroll diagram to categorize students based on study habits (good/poor) and extracurricular involvement (high/low). This visualization can reveal patterns and correlations that might not be immediately apparent in raw data or other chart types.
In project management, Carroll diagrams can be employed to prioritize tasks and allocate resources. Project managers can create a diagram that categorizes tasks based on urgency (high/low) and importance (critical/non-critical). This visual representation helps teams focus on high-priority items and ensures efficient resource allocation throughout the project lifecycle.
Carroll diagrams are particularly effective in scenarios where data needs to be classified based on multiple binary criteria. Unlike Venn diagrams, which can become cluttered with more than three sets, Carroll diagrams maintain clarity even with numerous attributes. This makes them ideal for complex classification tasks in fields such as genetics, where organisms might be categorized based on multiple gene expressions.
As you consider how to apply Carroll diagrams in your own work or studies, think about situations where you need to organize information based on distinct categories. These diagrams are especially useful when dealing with yes/no or true/false type classifications across multiple dimensions. For example, if you're a student analyzing literature, you might use a Carroll diagram to categorize books based on genre (fiction/non-fiction) and time period (modern/classic). This could help you identify patterns in literary trends or gaps in your reading list.
In conclusion, Carroll diagrams are versatile data visualization tools with applications across various fields. Their ability to clearly represent complex relationships makes them invaluable for data analysis, decision-making, and problem-solving. By incorporating Carroll diagrams into your analytical toolkit, you can enhance your ability to organize information, identify patterns, and draw meaningful insights from data. Whether you're a student, professional, or researcher, mastering the use of Carroll diagrams can significantly boost your analytical capabilities and decision-making processes.
Conclusion
In summary, Carroll diagrams are powerful tools for data organization, offering a structured approach to categorizing information. Unlike Venn diagrams, which show overlapping sets, Carroll diagrams use a grid system to sort data based on opposite attributes. This unique structure allows for clear visualization of relationships between categories. The introduction video provided crucial insights into creating and interpreting these diagrams, highlighting their versatility in various fields. To truly master this skill, it's essential to practice creating Carroll diagrams with different datasets. By doing so, you'll enhance your data organization skills and develop a deeper understanding of how to effectively categorize information. Remember, the key to proficiency lies in regular practice and application of these concepts. As you become more comfortable with Carroll diagrams, you'll find them invaluable for organizing complex data and identifying patterns that might otherwise be overlooked. Embrace this tool to elevate your analytical capabilities and streamline your approach to data management.
Introduction to Carroll Diagrams: How are Carroll Diagrams different from Venn Diagrams?
Carroll diagrams and Venn diagrams are both tools used to organize data based on attributes, but they have distinct differences in their structure and presentation. This guide will walk you through the key differences between these two types of diagrams.
Step 1: Understanding Venn Diagrams
Venn diagrams are familiar tools used to sort data based on attributes. They consist of overlapping circles, each representing a different attribute. The overlapping regions of the circles show where the attributes intersect. For example, if we have a set of numbers, we can use a Venn diagram to sort them based on whether they are even and whether they are greater than 5. The numbers that are both even and greater than 5 will be placed in the overlapping region of the two circles.
In a Venn diagram, the entire space within the rectangle represents the data set, and the circles represent different attributes. The regions where the circles overlap represent data points that share multiple attributes. Data points that do not fit into any of the circles are placed outside the circles but still within the rectangle.
Step 2: Introduction to Carroll Diagrams
Carroll diagrams, on the other hand, are structured like tables rather than circles. They also sort data based on attributes, but they do so in a grid format. Each cell in the grid represents a combination of attributes. For example, a 2x2 Carroll diagram might have one axis labeled "Even" and "Not Even" and the other axis labeled "Greater than 5" and "Not Greater than 5." This creates four cells, each representing a different combination of these attributes.
In a Carroll diagram, the data points are placed in the cells based on their attributes. For instance, a number that is even and greater than 5 would be placed in the cell where the "Even" row intersects with the "Greater than 5" column. This format allows for a clear and organized way to see how data points are distributed across different attribute combinations.
Step 3: Comparing the Structures
While both Venn diagrams and Carroll diagrams sort data based on attributes, their structures are quite different. Venn diagrams use overlapping circles to show the relationships between attributes, while Carroll diagrams use a grid format. This difference in structure can affect how easily one can interpret the data. Venn diagrams are often more visual and can make it easier to see the relationships between different attributes, especially when there are multiple attributes involved. Carroll diagrams, on the other hand, provide a more straightforward and organized way to see the exact combinations of attributes for each data point.
Step 4: Mapping Regions Between Diagrams
Despite their structural differences, the regions in a Carroll diagram can be mapped back to the regions in a Venn diagram. For example, the cell in a Carroll diagram that represents data points that are even and greater than 5 corresponds to the overlapping region of the two circles in a Venn diagram that represent these attributes. Similarly, the cell that represents data points that are not even and not greater than 5 corresponds to the region outside both circles in a Venn diagram.
This mapping shows that while the diagrams look different, they are essentially organizing the same information in different ways. Understanding this mapping can help in translating data from one type of diagram to the other.
Step 5: Practical Applications
Both Venn diagrams and Carroll diagrams have their own practical applications. Venn diagrams are particularly useful when you want to visualize the relationships between different sets of data and see where they overlap. They are commonly used in fields such as mathematics, logic, and statistics. Carroll diagrams, on the other hand, are useful when you need a clear and organized way to sort data based on multiple attributes. They are often used in educational settings to teach sorting and classification skills.
Choosing between a Venn diagram and a Carroll diagram depends on the specific needs of the task at hand. If you need to visualize the relationships between different sets of data, a Venn diagram might be more appropriate. If you need a clear and organized way to sort data based on multiple attributes, a Carroll diagram might be the better choice.
Conclusion
In summary, while Carroll diagrams and Venn diagrams both serve the purpose of organizing data based on attributes, they do so in different ways. Venn diagrams use overlapping circles to show relationships between attributes, while Carroll diagrams use a grid format to show combinations of attributes. Understanding the differences between these two types of diagrams can help you choose the right tool for your data organization needs.
FAQs
-
What is a Carroll diagram?
A Carroll diagram is a visual tool used to organize and classify data based on specific attributes. It's named after Lewis Carroll and consists of a grid-like structure where data points are sorted into categories based on whether they possess certain characteristics or not.
-
How does a Carroll diagram differ from a Venn diagram?
While both diagrams are used for data organization, Carroll diagrams use a grid structure with clearly defined boundaries for each category, based on yes/no attributes. Venn diagrams, on the other hand, use overlapping circles to show relationships between sets. Carroll diagrams are better suited for binary classifications across multiple attributes.
-
What are opposite attributes in Carroll diagrams?
Opposite attributes in Carroll diagrams are pairs of mutually exclusive characteristics used to categorize data. For example, "even" and "odd" for numbers, or "has wings" and "doesn't have wings" for animals. These attribute pairs create distinct categories that cover all possible options for the data being classified.
-
How do you create a Carroll diagram?
To create a Carroll diagram: 1) Choose two pairs of opposite attributes, 2) Draw a rectangle and divide it into four sections, 3) Label the top and left side with your attributes, 4) Add "Yes" and "No" labels for each attribute, 5) Sort your data points into the appropriate sections based on their characteristics.
-
What are some practical applications of Carroll diagrams?
Carroll diagrams have various applications, including: education (teaching set theory and classification), business (customer segmentation), quality control (defect classification), data science (exploratory data analysis), and project management (task prioritization). They are particularly useful in scenarios requiring classification based on multiple binary criteria.
Prerequisite Topics
Before delving into the world of Carroll diagrams, it's crucial to have a solid foundation in certain prerequisite topics. One of the most important concepts to grasp is the classification of data. Understanding this fundamental principle is essential for effectively utilizing Carroll diagrams and maximizing their potential in data organization and analysis.
Carroll diagrams are powerful tools used to sort and categorize information based on specific attributes or characteristics. To fully appreciate their functionality and application, a strong grasp of data classification techniques is paramount. The ability to identify, organize, and group data according to shared properties forms the backbone of working with Carroll diagrams.
When exploring data classification techniques, students learn how to distinguish between different types of data and recognize patterns within datasets. This knowledge directly translates to the creation and interpretation of Carroll diagrams. By understanding how to classify data effectively, students can more easily construct meaningful categories and subcategories within a Carroll diagram, leading to clearer visual representations of complex information.
Moreover, the principles of data classification help in determining which attributes are most relevant for sorting information in a Carroll diagram. This skill is crucial for creating diagrams that are not only accurate but also insightful and useful for decision-making processes. Without a solid understanding of data classification, students might struggle to identify the most appropriate criteria for organizing information within a Carroll diagram, potentially leading to confusion or misinterpretation of the data.
The connection between classification of data and Carroll diagrams extends beyond mere organization. It also influences how we interpret the relationships between different data points and categories. By mastering data classification techniques, students develop a keener eye for spotting trends, outliers, and patterns within Carroll diagrams, enhancing their analytical skills and decision-making capabilities.
Furthermore, understanding data classification provides a foundation for more advanced statistical concepts and data visualization techniques. As students progress in their studies, they'll find that the principles learned in data classification are applicable to a wide range of analytical tools and methods, with Carroll diagrams being just one example of how these fundamental concepts are put into practice.
In conclusion, the importance of grasping data classification techniques as a prerequisite to studying Carroll diagrams cannot be overstated. It equips students with the necessary skills to effectively create, interpret, and analyze Carroll diagrams, setting the stage for more advanced data analysis and visualization techniques. By investing time in understanding this foundational concept, students will be better prepared to tackle the complexities of Carroll diagrams and apply them successfully in various academic and real-world scenarios.