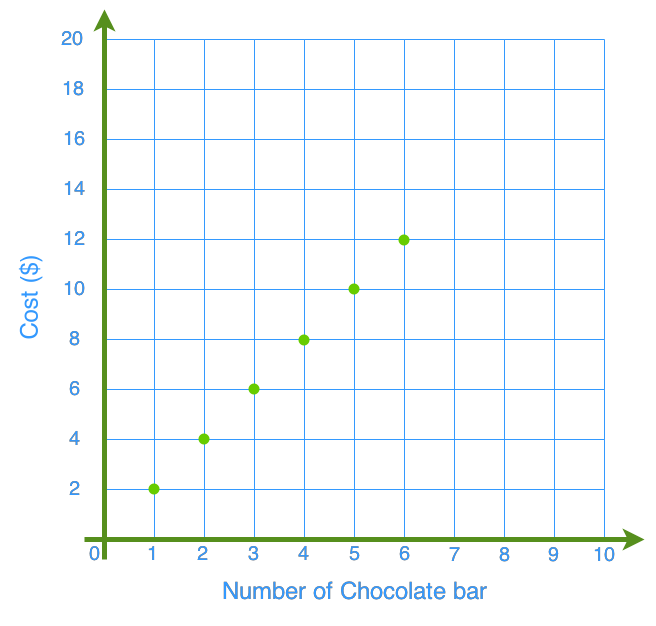
The graph below shows the cost of chocolate bars.
.
Describe the patterns represented on the graph.
Create a table of values from the graph.
From the graph, estimate the cost of 12 chocolate bars.
It is reasonable to add a point between the ones on the graph? Why or why not?
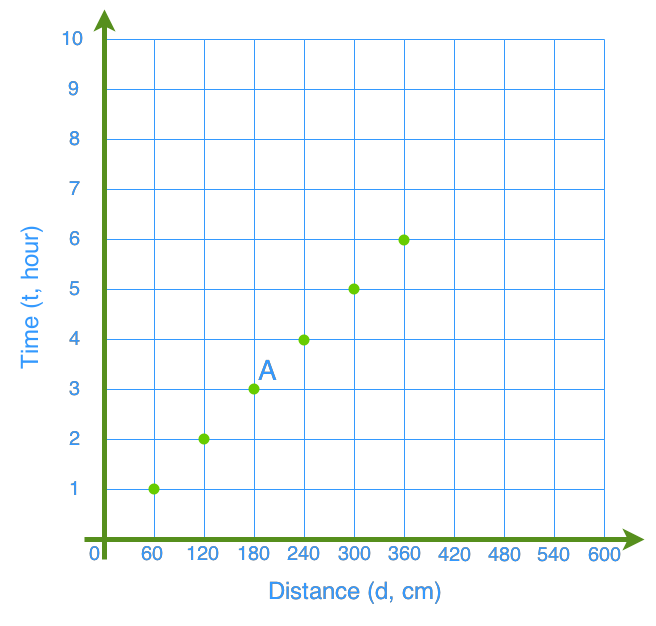
The graph shows the distance a car travels.
.
What does (180, 3) represent?
What is the speed of the car at point A?
Is the graph showing a linear relationship? Why or why not?
It is reasonable to add a point between the ones on the graph? Explain.
Free to Join!
StudyPug is a learning help platform covering maths and science from primary all the way to second year university. Our video tutorials, unlimited practice problems, and step-by-step explanations provide you or your child with all the help you need to master concepts. On top of that, it's fun — with achievements, customizable avatars, and awards to keep you motivated.
We track the progress you've made on a topic so you know what you've done. From the course view you can easily see what topics have what and the progress you've made on them. Fill the rings to completely master that section or mouse over the icon to see more details.
Make Use of Our Learning Aids
Last Viewed
Practice Accuracy
Suggested Tasks
Get quick access to the topic you're currently learning.
See how well your practice sessions are going over time.
Make the most of your time as you use StudyPug to help you achieve your goals. Earn fun little badges the more you watch, practice, and use our service.
Create and Customize Your Avatar
Play with our fun little avatar builder to create and customize your own avatar on StudyPug. Choose your face, eye colour, hair colour and style, and background. Unlock more options the more you use StudyPug.
Without understanding and analyzing, graphs of linear relationships are just lines and dots. In this lesson, we will learn the skills to analyze the graphs and get useful information from them.