Advantages and disadvantages of different graphs
Examples
Lessons
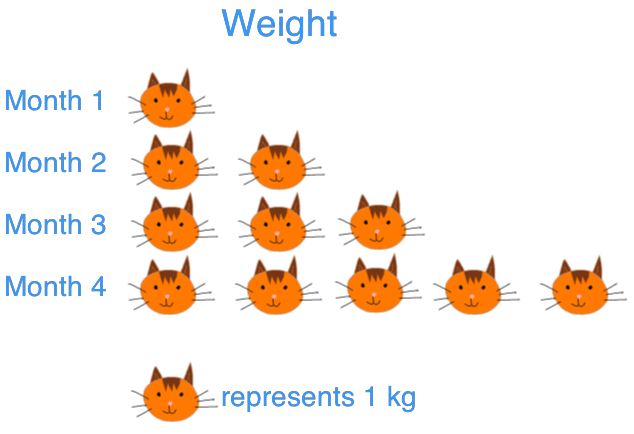
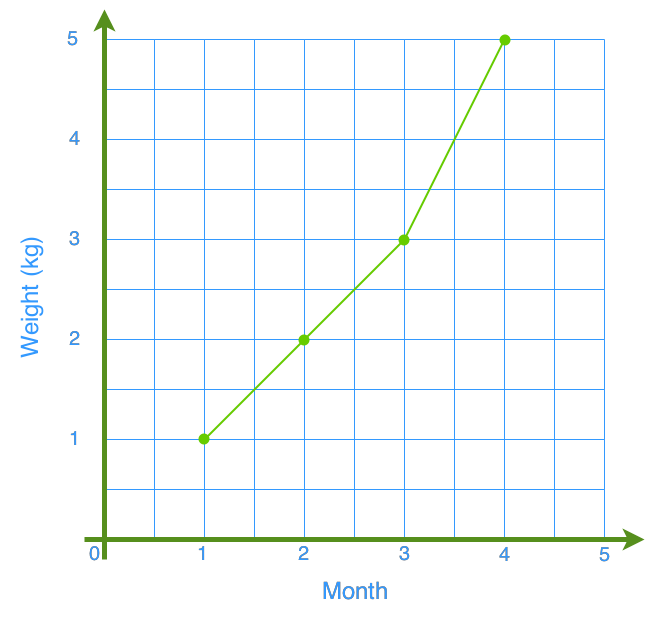
- Jane measured the weight of her kitten at the end of every month. She used a pictograph and a line graph to display the data.
Month
1
2
3
4
Weight (kg)
1
2
3
5
- City A
City BMonth
Jan
Feb
Mar
Apr
May
Jun
Jul
Aug
Sep
Temperature (°C)
8
9
11
14
17
20
23
23
20
Month
Jan
Feb
Mar
Apr
May
Jun
Jul
Aug
Sep
Temperature (°C)
9
9
12
18
22
25
27
30
26
- Draw a double bar graph and a double line graph to display the data above.

- What are the similarities and differences between the trends of temperature change for City A and City B?
- Which graph is able to show the data more clearly? Explain.
- Can two circle graphs be effective for displaying the data? Explain.
- Draw a double bar graph and a double line graph to display the data above.