Long run cost
Topic Notes
In the long run, all inputs and costs are variables.
Long-run Production Function: the relationship between the output and the quantities of both capital and labour.
The function is not graphable in a 2D graph, but it can be shown in a table.
|
Labour (workers per week) |
Output (Cars per week) |
|||
|
Factory 1 (1 machine) |
Factory 2 (2 machines) |
Factory 3 (3 machines) |
Factory 4 (4 machines) |
|
|
1 |
9 |
14 |
17 |
19 |
|
2 |
14 |
19 |
22 |
24 |
|
3 |
17 |
22 |
25 |
27 |
|
4 |
19 |
24 |
27 |
29 |
|
5 |
20 |
25 |
28 |
30 |
Marginal Product of Capital: the additional total product from a one-unit increase of capital.
Diminishing Returns of Labour: can be shown by allowing labour to vary and keeping capital constant.
Diminishing Returns of Capital: can be shown by allowing capital to vary and keeping labour constant.
Each column of the table could be graphed as a total product curve for each factory.
Short-Run Costs & Total Average Cost
Recall that the total average cost is:
We can use this formula to calculate the short-run average total cost for each factory. Suppose the cost for each worker is $10, and the cost for each machine is 10$.
Then for factory 1 and 2, you get the following table,
|
# of Machines & Labour |
TC |
Q |
ATC1
|
|
1 machine, 1 worker |
20 |
9 |
$2.22 |
|
1 machine, 2 workers |
30 |
14 |
$2.14 |
|
1 machine, 3 workers |
40 |
17 |
$2.35 |
|
1 machine, 4 workers |
50 |
19 |
$2.63 |
|
1 machine, 5 workers |
60 |
20 |
$3.00 |
|
# of Machines & Labour |
TC |
Q |
ATC2
|
|
2 machine, 1 worker |
30 |
14 |
$2.14 |
|
2 machine, 2 workers |
40 |
19 |
$2.11 |
|
2 machine, 3 workers |
50 |
22 |
$2.27 |
|
2 machine, 4 workers |
60 |
24 |
$2.50 |
|
2 machine, 5 workers |
70 |
25 |
$2.80 |
Then for factory 3 and 4, we will get
|
# of Machines & Labour |
TC |
Q |
ATC3
|
|
3 machine, 1 worker |
40 |
17 |
$2.35 |
|
3 machine, 2 workers |
50 |
22 |
$2.27 |
|
3 machine, 3 workers |
60 |
25 |
$2.40 |
|
3 machine, 4 workers |
70 |
27 |
$2.59 |
|
3 machine, 5 workers |
80 |
28 |
$2.86 |
|
# of Machines & Labour |
TC |
Q |
ATC4
|
|
4 machine, 1 worker |
50 |
19 |
$2.63 |
|
4 machine, 2 workers |
60 |
24 |
$2.50 |
|
4 machine, 3 workers |
70 |
27 |
$2.59 |
|
4 machine, 4 workers |
80 |
29 |
$2.76 |
|
4 machine, 5 workers |
90 |
30 |
$3.00 |
We can now graph all the ATC curves into one graph.
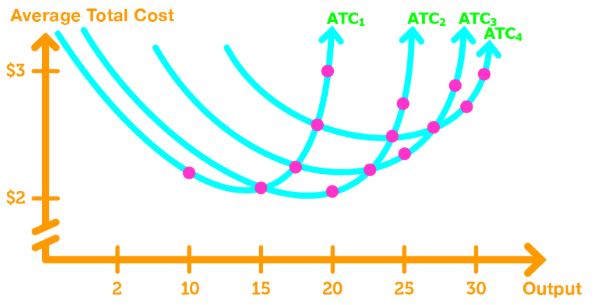
Note 1: All ATC curves are U shaped.
Note 2: The more machines there are, the bigger the output is at which average total cost is at a minimum.
Long Run Average Cost
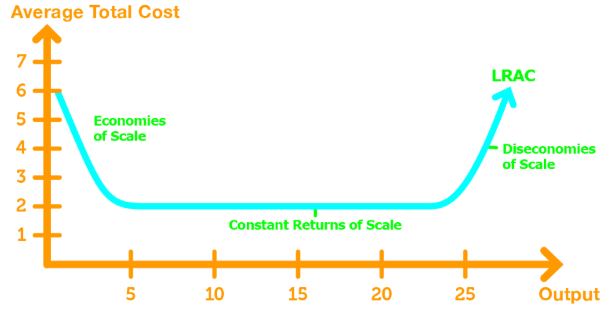
Long-Run Average Cost (LRAC) is the relationship between the lowest average total cost attainable and output when the firm can change both the factories and the number of labours it employs.
To draw the LRAC, we draw a curve that is tangent to all ATC's.
Economies & Diseconomies of Scale
Economies of Scale: the area in which the LRAC decreases as output increases.
Diseconomies of Scale: the area in which LRAC increases as output increases.
Constant Returns to Scale: the area in which LRAC is horizontal as output increases.
Minimum Efficient Scale: the point in the LRAC curve where the lowest possible cost is attained.