Curve sketching
Topic Notes
In this section we will expand our knowledge on the connection between derivatives and the shape of a graph. By following the "5-Steps Approach", we will quantify the characteristics of the function with application of derivatives, which will enable us to sketch the graph of a function.
Guidelines for Curve Sketching
a) domain
b) Intercepts
y-intercept: set x=0 and evaluate y.
x-intercept: set y=0 and solve for x. (skip this step if the equation is difficult to solve)
c) Asymptotes
vertical asymptotes: for rational functions, vertical asymptotes can be located by equating the denominator to 0 after canceling any common factors.
horizontal asymptotes: evaluate to determine the right-end behavior;
evaluate to determine the left-end behavior.
slant asymptotes: for rational functions, slant asymptotes occur when the degree of the numerator is one more than the degree of the denominator.
d) Compute
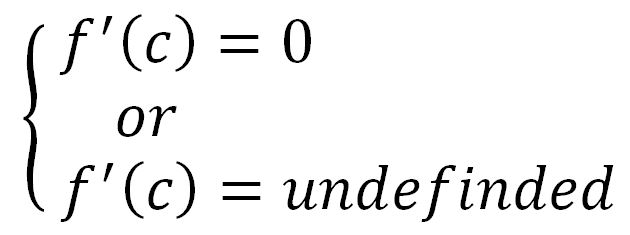
find the critical numbers:
 • use the First Derivative Test to find: intervals of increase/decrease and local extrema.
e) Compute • inflection points occur where the direction of concavity changes.
find possible inflection points by equating the to 0.
•Concavity Test:
• use the First Derivative Test to find: intervals of increase/decrease and local extrema.
e) Compute • inflection points occur where the direction of concavity changes.
find possible inflection points by equating the to 0.
•Concavity Test: •inflection points occur where the direction of concavity changes.
• use the First Derivative Test to find: intervals of increase/decrease and local extrema.
e) Compute • inflection points occur where the direction of concavity changes.
find possible inflection points by equating the to 0.
•Concavity Test:
•inflection points occur where the direction of concavity changes.