Reading and drawing line graphs
Everything You Need in One PlaceHomework problems? Exam preparation? Trying to grasp a concept or just brushing up the basics? Our extensive help & practice library have got you covered. | Learn and Practice With EaseOur proven video lessons ease you through problems quickly, and you get tonnes of friendly practice on questions that trip students up on tests and finals. | Instant and Unlimited HelpOur personalized learning platform enables you to instantly find the exact walkthrough to your specific type of question. Activate unlimited help now! |
Make math click 🤔 and get better grades! 💯Join for Free
Get the most by viewing this topic in your current grade. Pick your course now.
Intros
Examples
Lessons
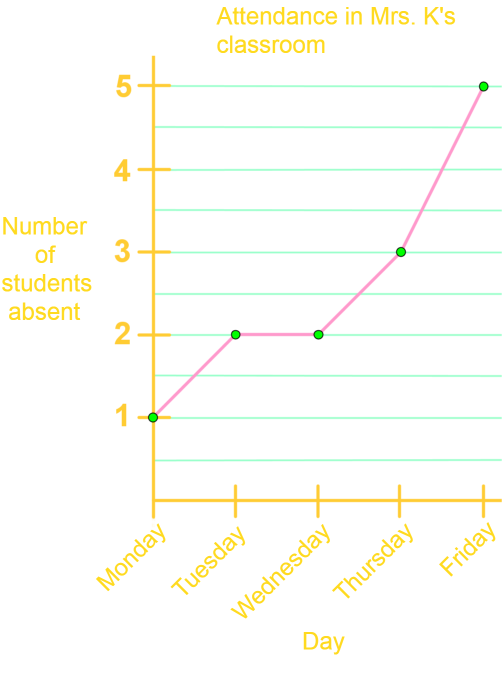
- Mrs. K created a graph to keep track of attendance in her classroom over a week.
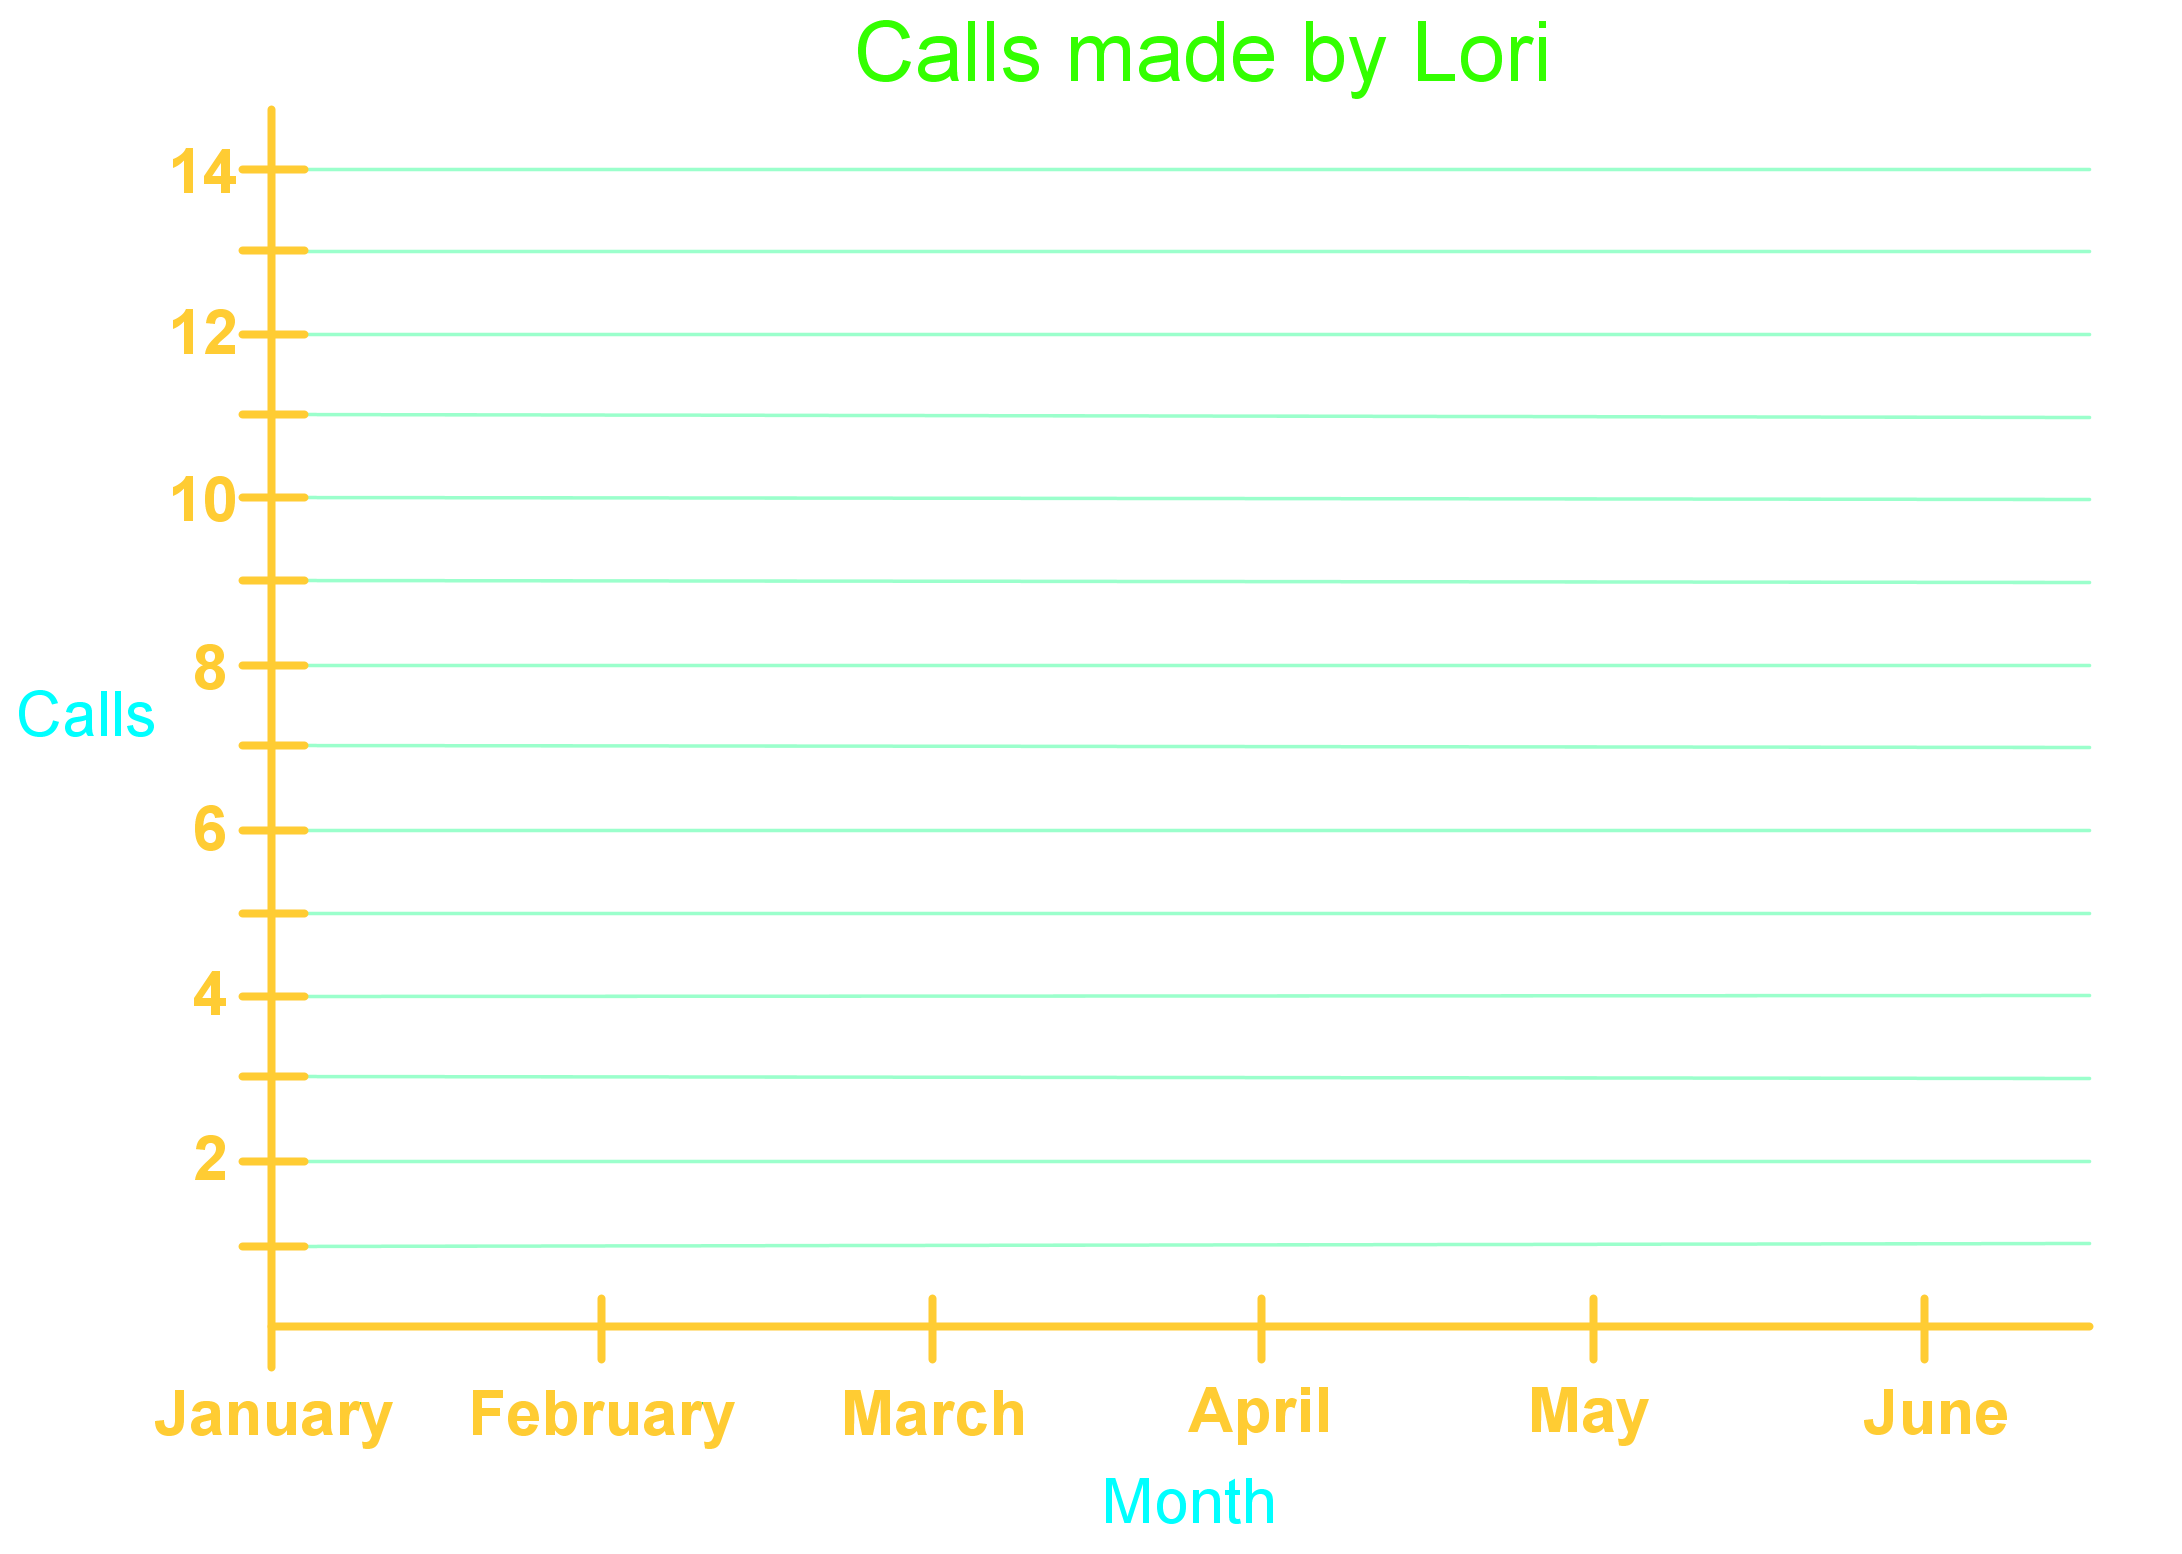
- Lori kept track of the number of long distance calls she made over a 6 month period.
Calls made by Lori:
Month
Calls
January
10
February
5
March
8
April
6
May
4
June
3
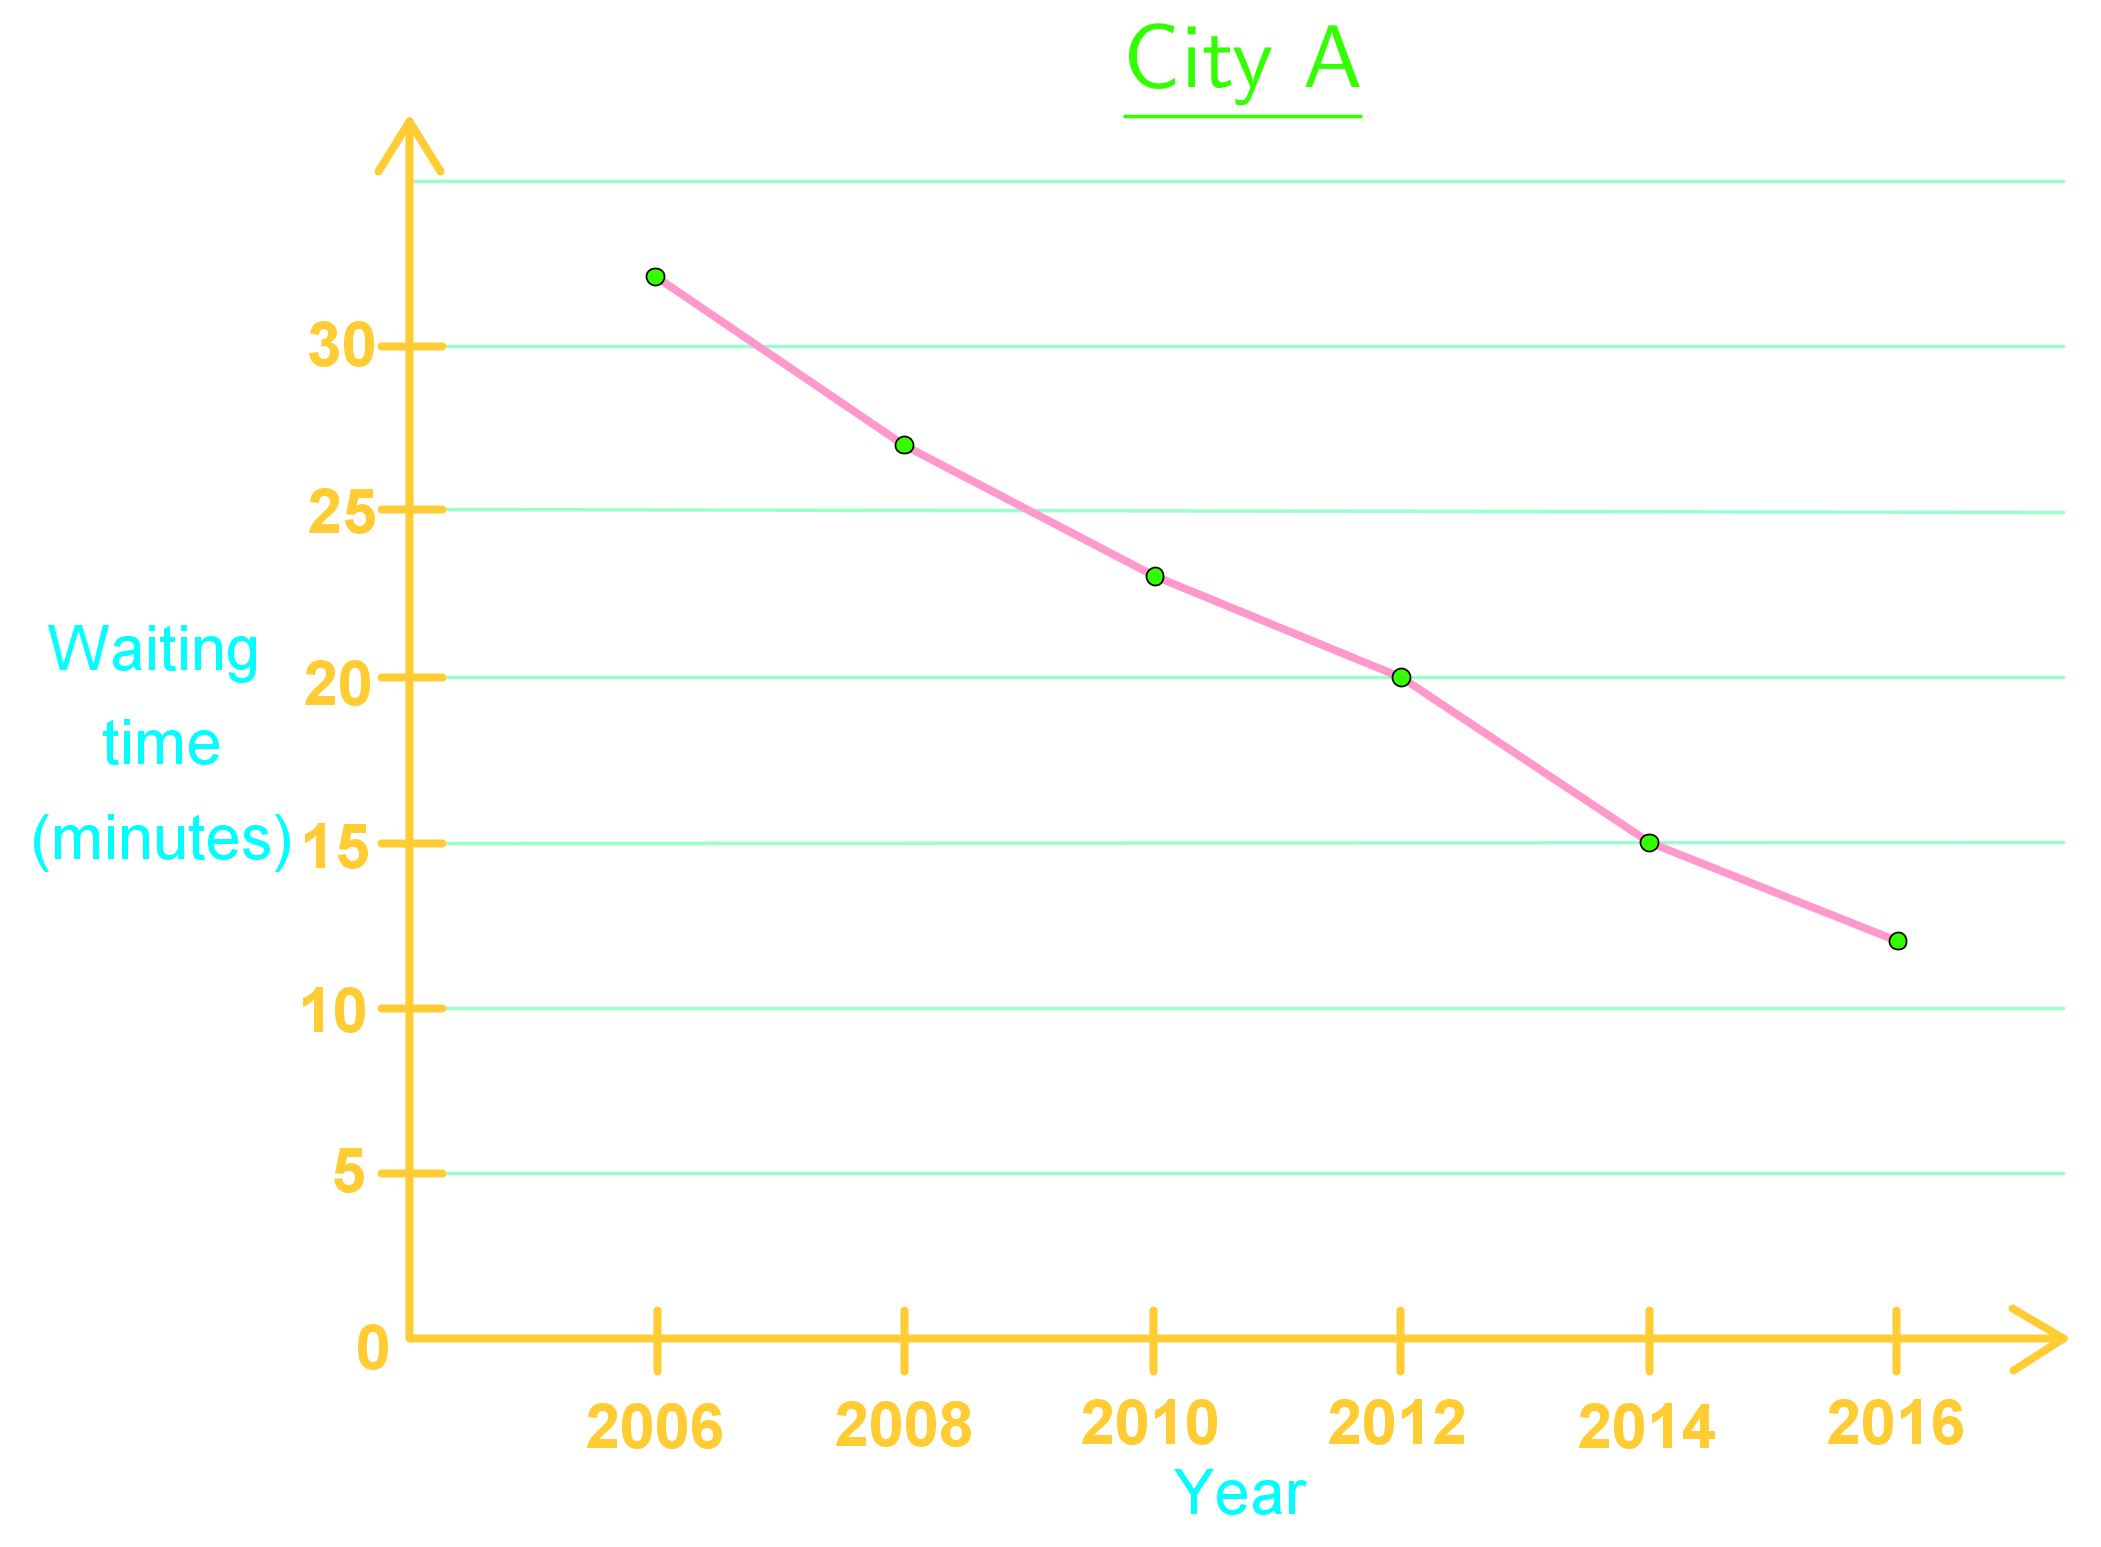
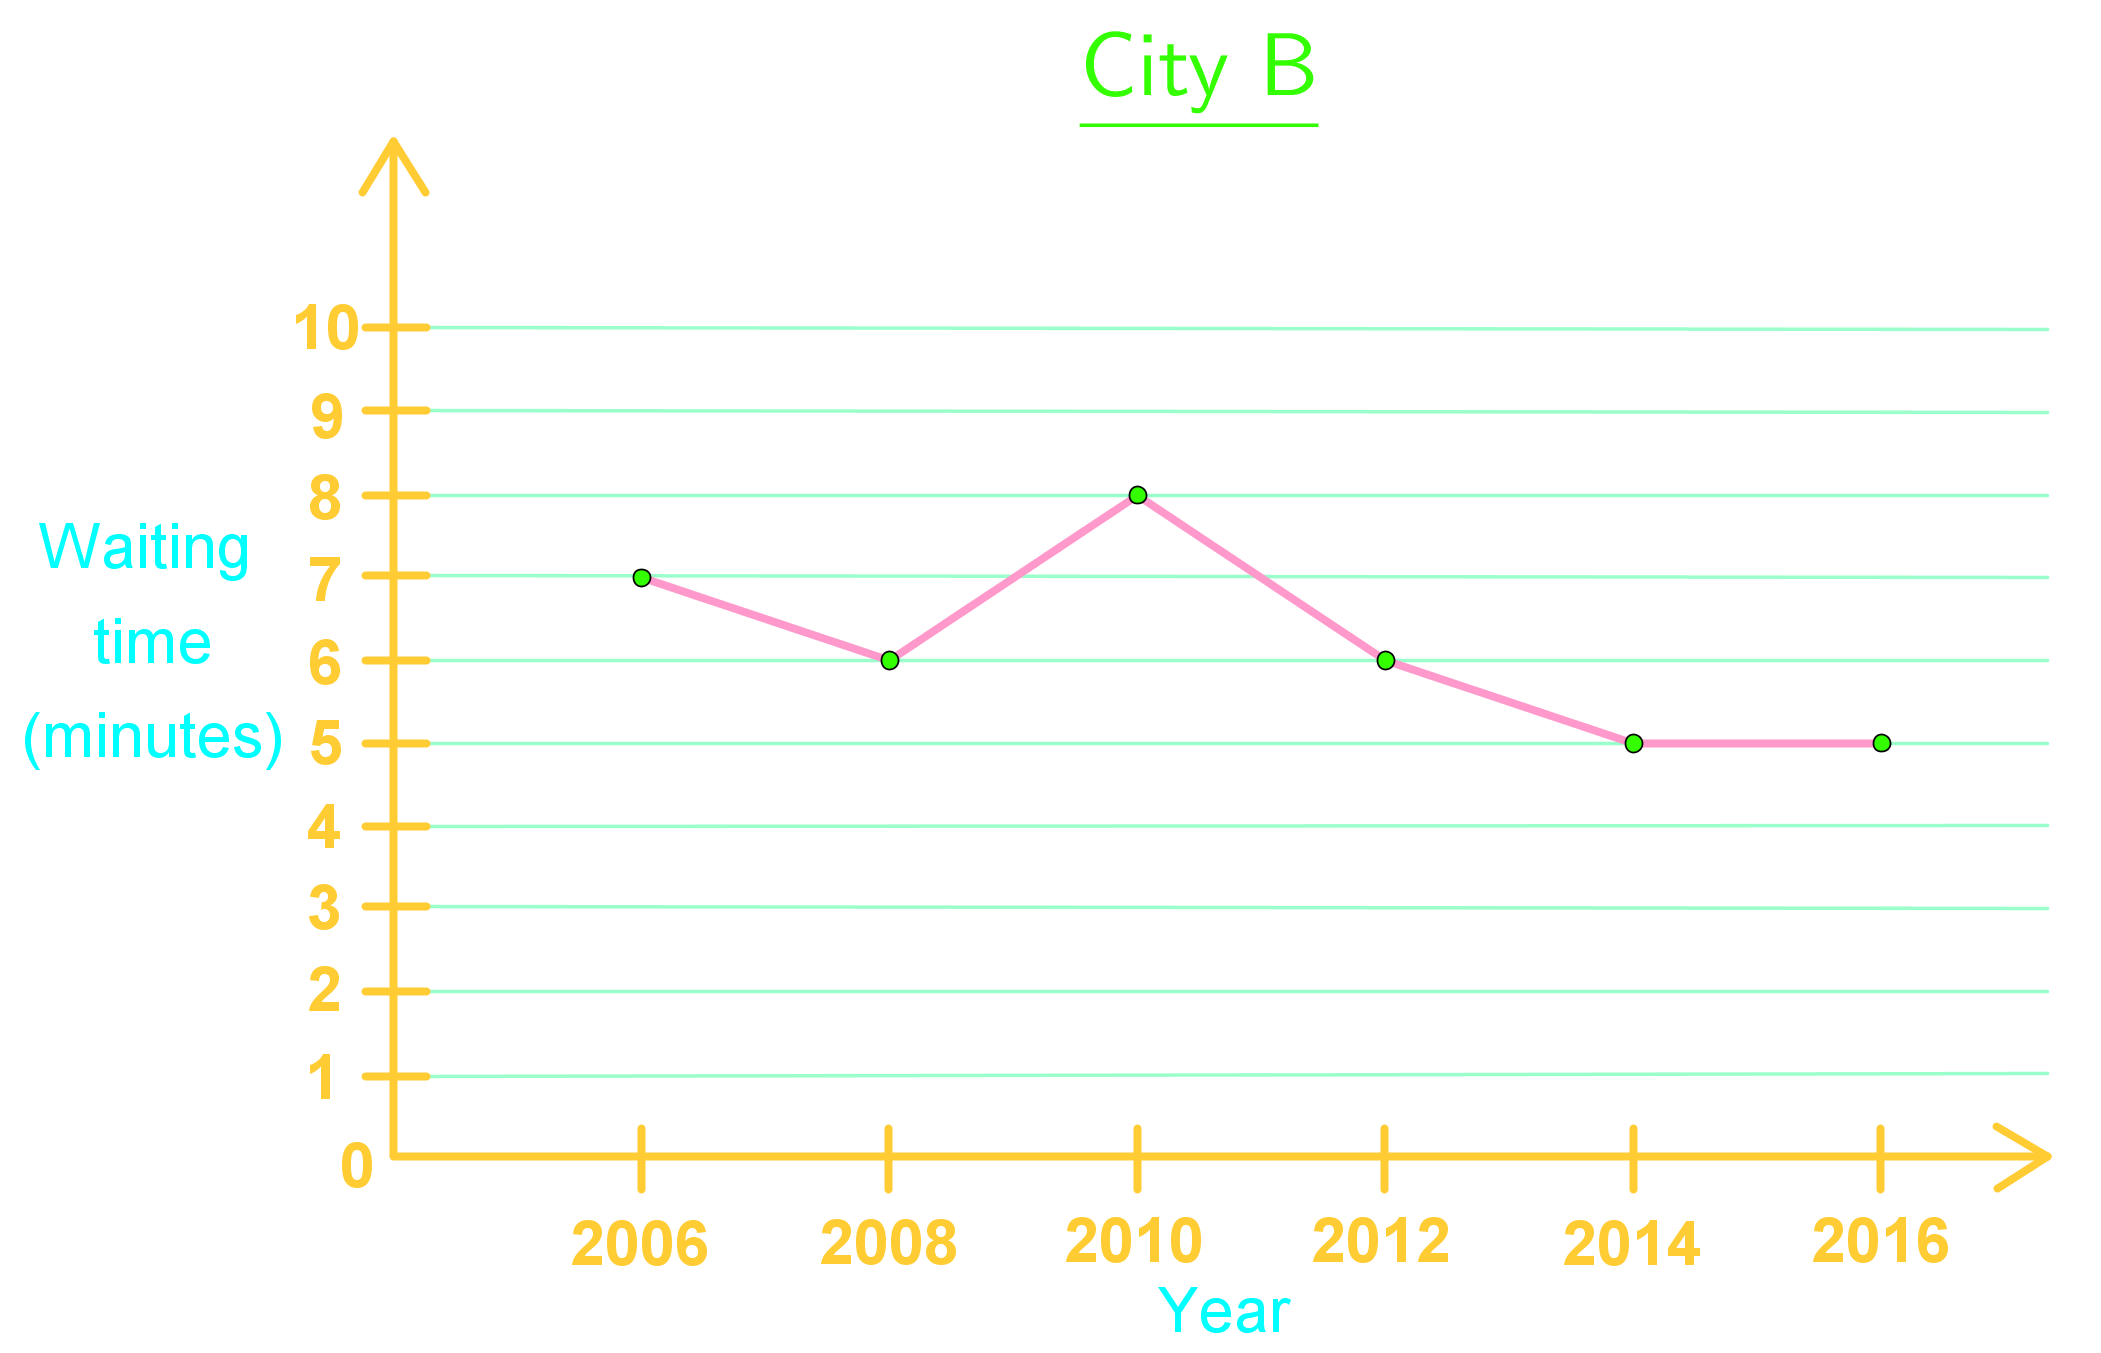
- The governments of two cities claim that they have done a very successful job in developing the public transit system over the past 10 years. Below are line graphs showing the average waiting times for a bus in the two cities in the past 10 years.