Regression analysis
Everything You Need in One PlaceHomework problems? Exam preparation? Trying to grasp a concept or just brushing up the basics? Our extensive help & practice library have got you covered. | Learn and Practice With EaseOur proven video lessons ease you through problems quickly, and you get tonnes of friendly practice on questions that trip students up on tests and finals. | Instant and Unlimited HelpOur personalized learning platform enables you to instantly find the exact walkthrough to your specific type of question. Activate unlimited help now! |
Make math click 🤔 and get better grades! 💯Join for Free
Get the most by viewing this topic in your current grade. Pick your course now.
Intros
Examples
Lessons
- Interpolation and Extrapolation
A study took a sample of 14 cars and found the age of each car and the amount of money that each car is worth. A best fit line is given by the equation , where y is the worth of the car in dollars and is the age of the car in years.
- A study was done on 17 factory workers on their coffee consumption and how many boxes they were able to move per hour. The results of this study are given in the graph below:
The trend line is given as: , with being the number of boxes moved per hour and being the number of coffees drunk. - Finding the Best Fitting Curve
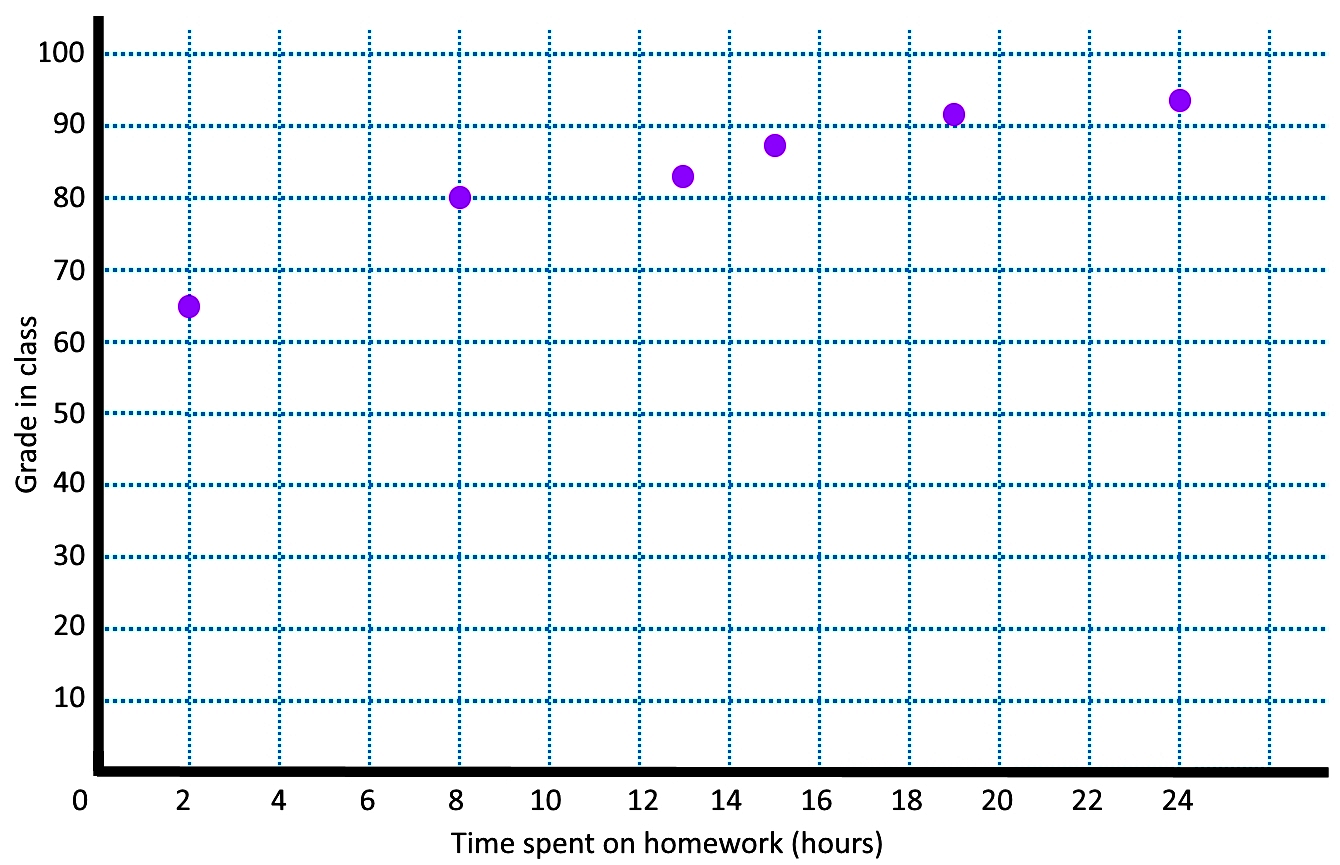
- Plot the following bivariate data as a scatter plot, with the time spent on homework on the x-axis.
Time Spent on Homework
Grade in Class
2 hours
65%
8 hours
80%
13 hours
83%
15 hours
87%
19 hours
91%
24 hours
93%
- Make a line of best fit using the student who spent 8 hours on homework and the student who spent 15 hours studying
- Using the best fit line found in the previous part, estimate what mark a student would achieve in this class if they spent 14 hours on homework
- Plot the following bivariate data as a scatter plot, with the time spent on homework on the x-axis.


Topic Notes
Table of Contents:
- Regression analysis
- What is regression analysis
- How to do regression analysis
- Example 1
- How to interpret regression analysis
- Example 2
- Example 3
Regression analysis
Having learnt about bivariate data, scatter plots and correlation in our last section, our topic of today will be focused on using all three of these concepts to study a method for estimation of data called regression analysis.
What is regression analysis
Remember that correlation is the relationship between the two variables in a bivariate data set which depends on the behaviour shown by the variables and their probable dependency on one another? Well, regression analysis makes use of this by looking into the dependency of one variable with the other and the produced effect on the scatter plot where these two variables are represented; therefore, scatter plots, correlation and regression analysis go hand in hand and we will be using them throughout this lesson.
It is important to note that although we could simply define regression analysis as the estimation of our bivariate data, regression analysis is not exclusive of bivariate data! You can make a regression analysis on a multivariate set of data, or in other words, as long as you have more than one variable and these are related to each other by a certain dependency, you can make a regression analysis to make estimations of needed values. A regression analysis of a multivariate data set can be called a multivariate regression analysis if it meets certain conditions.
So, what is a regression analysis in simple words? Is a model that is constructed trying to represent, as precisely as possible, the relationship between two or more variables where one is an independent variable, and the other one is a dependent variable; furthermore, if many variables are involved in the data set, there is usually one dependent, and many independent variables; this process is called a multiple regression analysis and differs from the multivariate regression analysis mentioned above, where there are multiple dependant variables that share the independent variables. The regression analysis model is used to make estimations of data values not included in the set (either because they havent been calculated, or because they belong to ranges outside of the given one).
You may be wondering: how does regression analysis work then? Very simple! Having a measured data set, the values in the set are used to make a calculation of the best estimation of data points that are not present in our data set by looking at the proportion of one variable with the other, or at its behaviour with respect to the other. This way, regression analysis can estimate future values (those which are not present in the set because they are in the future timeline of the data, not only in a timeframe but in a numerical way too), past data values, or even values within the data points we already have.
So far, this regression analysis definition may sound confusing, or if it makes sense, it may seem a little broad; you may be wondering: how is this different from just using a scatter plot to see the correlation of a data set with more than one value? Well, in reality, on our last lesson we saw cases where the variables in a data set had no relation to each other (they had no correlation), but regression analysis can only be done on sets with variables having a certain relationship among them. Depending on the type of relationships between the variables, there are different types of regression analysis; since we learnt about linear correlation in our last lesson (positive or negative correlation of data points with a straight line tendency), this lesson will focus on linear regression analysis:
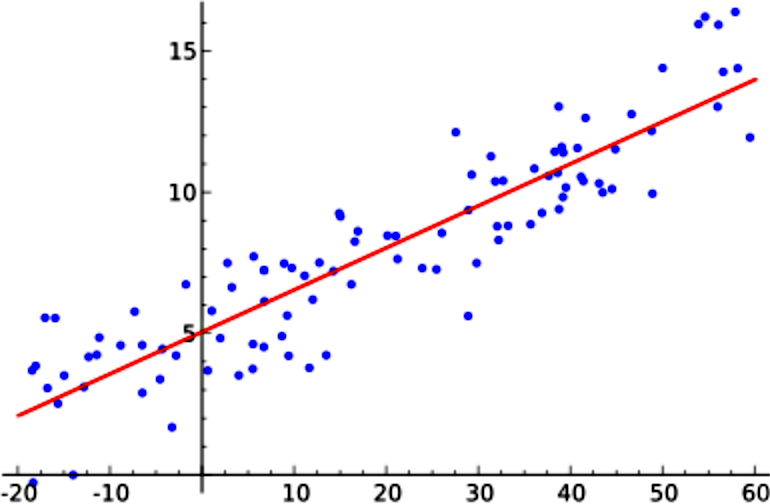
Figure 1 shows a graph for a linear regression analysis, notice how the data points in the scatter plot are in locations that allow us to see there is a positive correlation between them (as values increase for one variable, they increase for the other too).
How to do regression analysis
Regression analysis is usually done by looking for the line of best fit in a data set scatter plot.
This line of best fit is the simplest model for regression analysis but there are others, as we mentioned before, we will focus on linear regression analysis for this lesson and so the line of best fit is a great option for you to start practicing this type of data analysis.
We will dedicate a whole lesson to the computation of the equation of the best fit line (thats our next lesson), for now we will compute it in its simplest form and call it the trend line which is another name that is given to this particular line.
We have mentioned that regression analysis is used to compare more than one variable with each other, and to find missing data points in our plots; therefore, when computing simple regression analysis and estimating missing values, we call these estimations as:
- Interpolation is our estimation of finding a new data point that lies within our known set of data points.
- Extrapolation is our estimation of a new data point that lies outside our known set of data points.
Let us work in an example of regression analysis statistics to see how the process is done:
Example 1
Using the data for regression analysis of the time spent doing homework correlated with the final grade of a student in a class, which is provided in the table below, work through parts a, b and c of this example problem.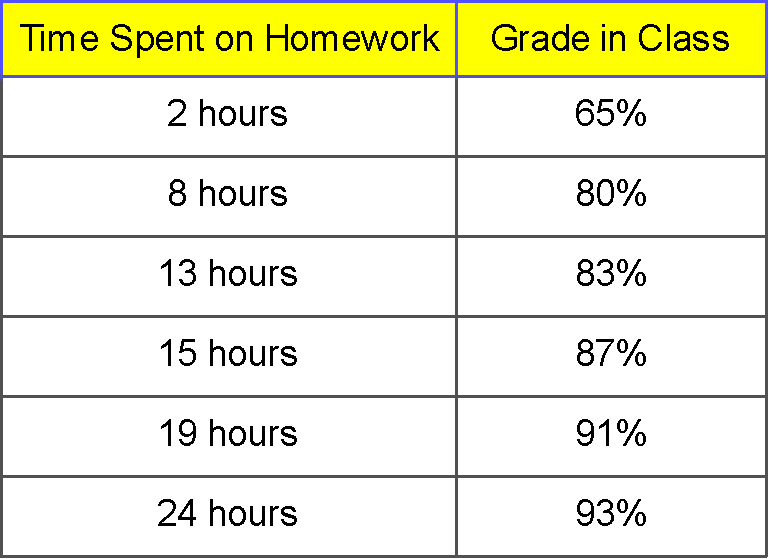
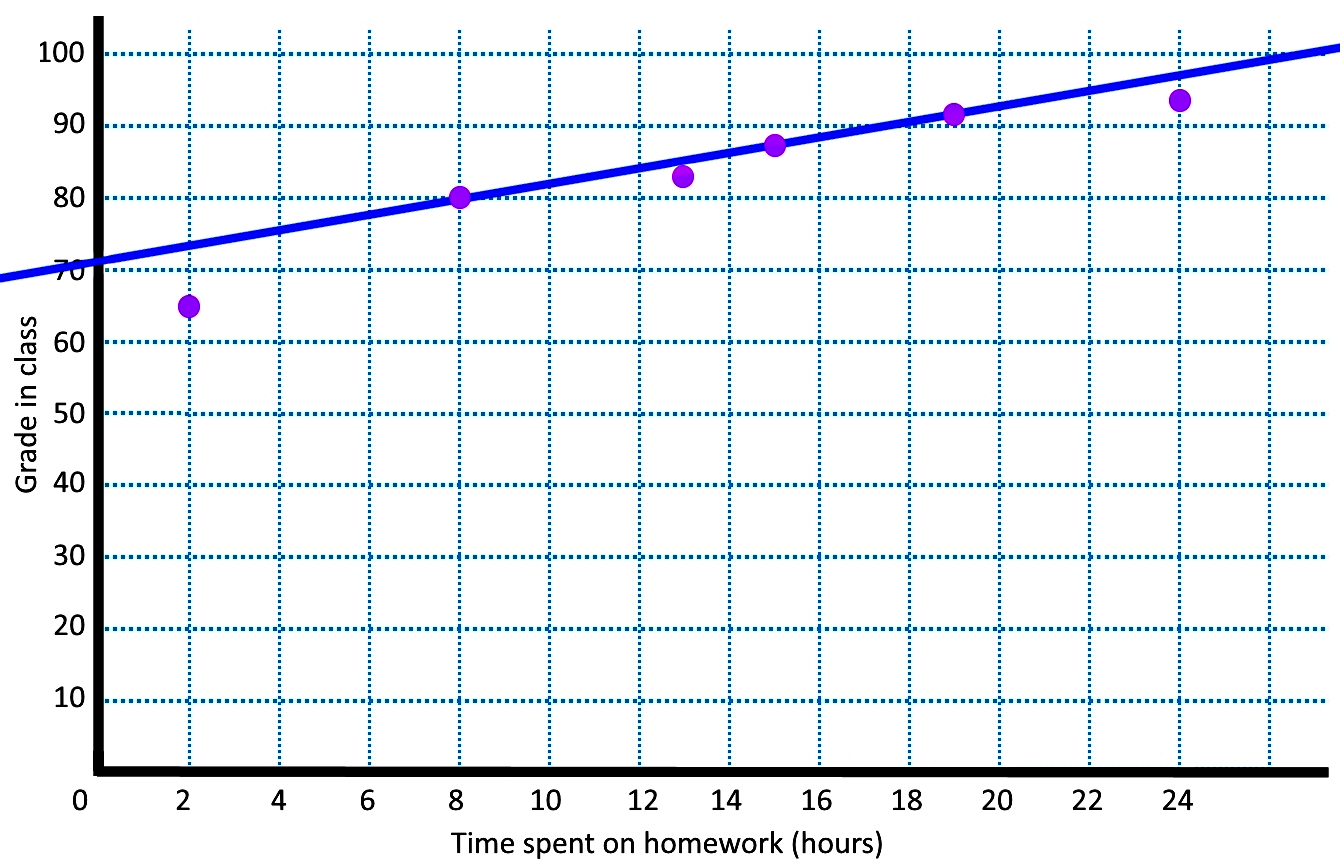
We found the line of best fit by using the two data points of (8,80) and (15,87), with that, we can obtain the equation for the line using the formula for the slope of the line:
By looking at the graph we can see that a student spending 14 hours doing homework would achieve an approximate grade of 86%. We confirm this by using the equation for the best fit line seen above:
How to interpret regression analysis
In order to practice the interpretation of a graph once we have applied regression analysis, let us take a look at the next examples:
Example 2
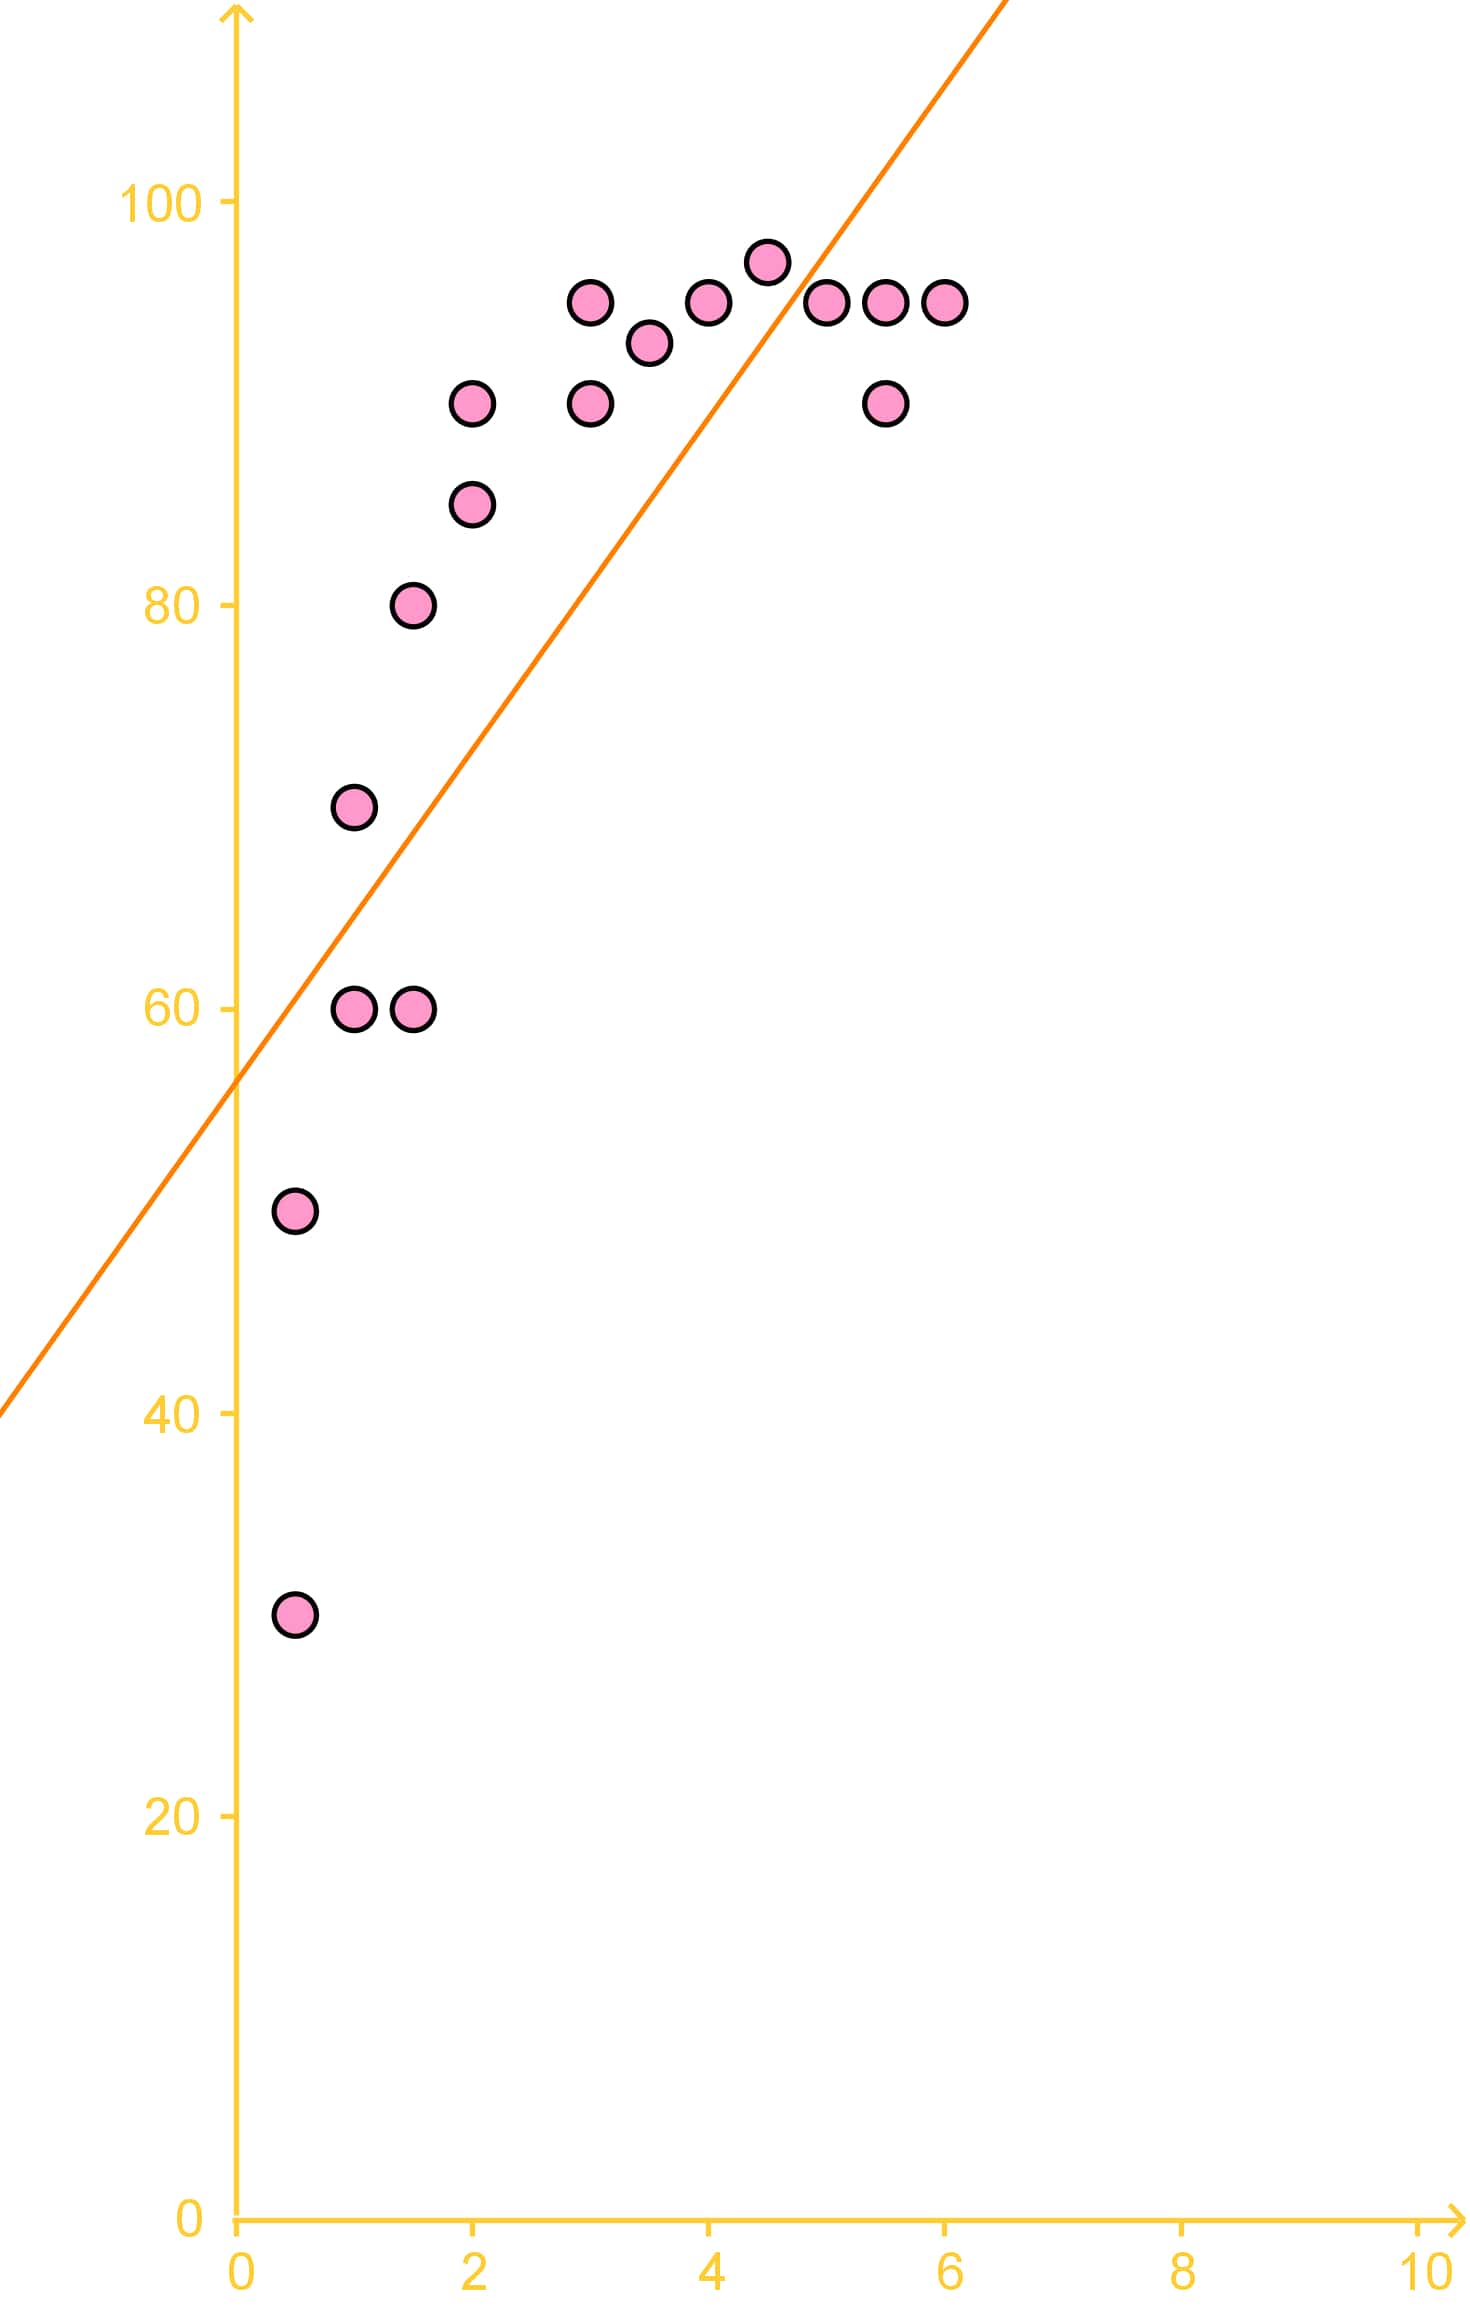
study was done on 17 factory workers on their coffee consumption and how many boxes they were able to move per hour. The results of this study are given in the graph below:
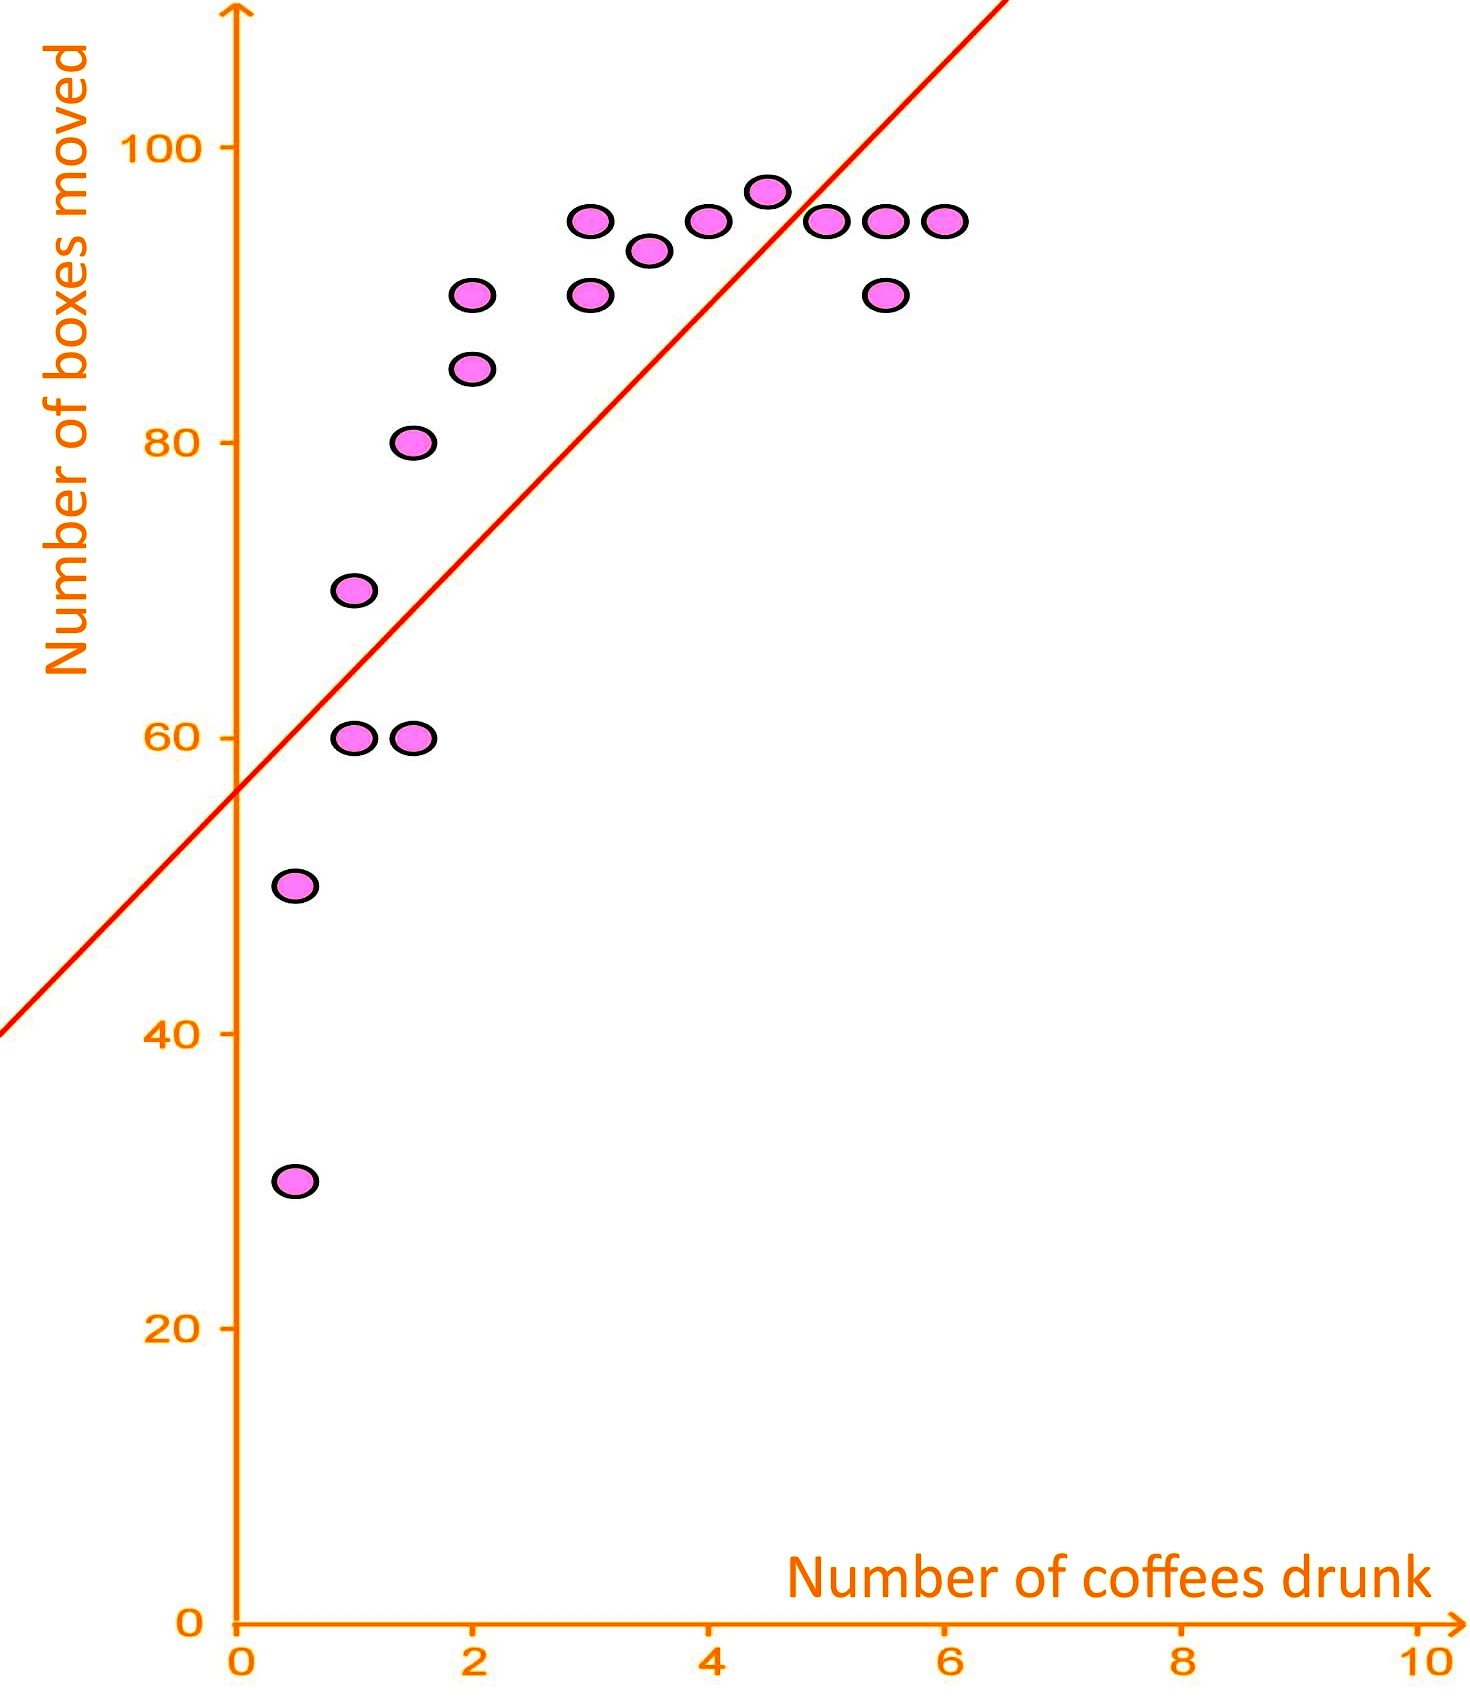
The trend line is given as: y = 8x + 56, with y (vertical axis) being the number of boxes moved per hour and x (horizontal axis) being the number of coffees drunk.
To answer this question we just use the equation for the best fit line, which is the equation provided for the trend line above: .
For this case , therefore: .
So, according to this regression analysis example a worker drinking 15 coffees would move 176 boxes per hour, but DONT EVER TRY THIS!
Remember this is just a hypothetical scenario, NO ONE should drink that much coffee in a day, less in an hour, is dangerous!
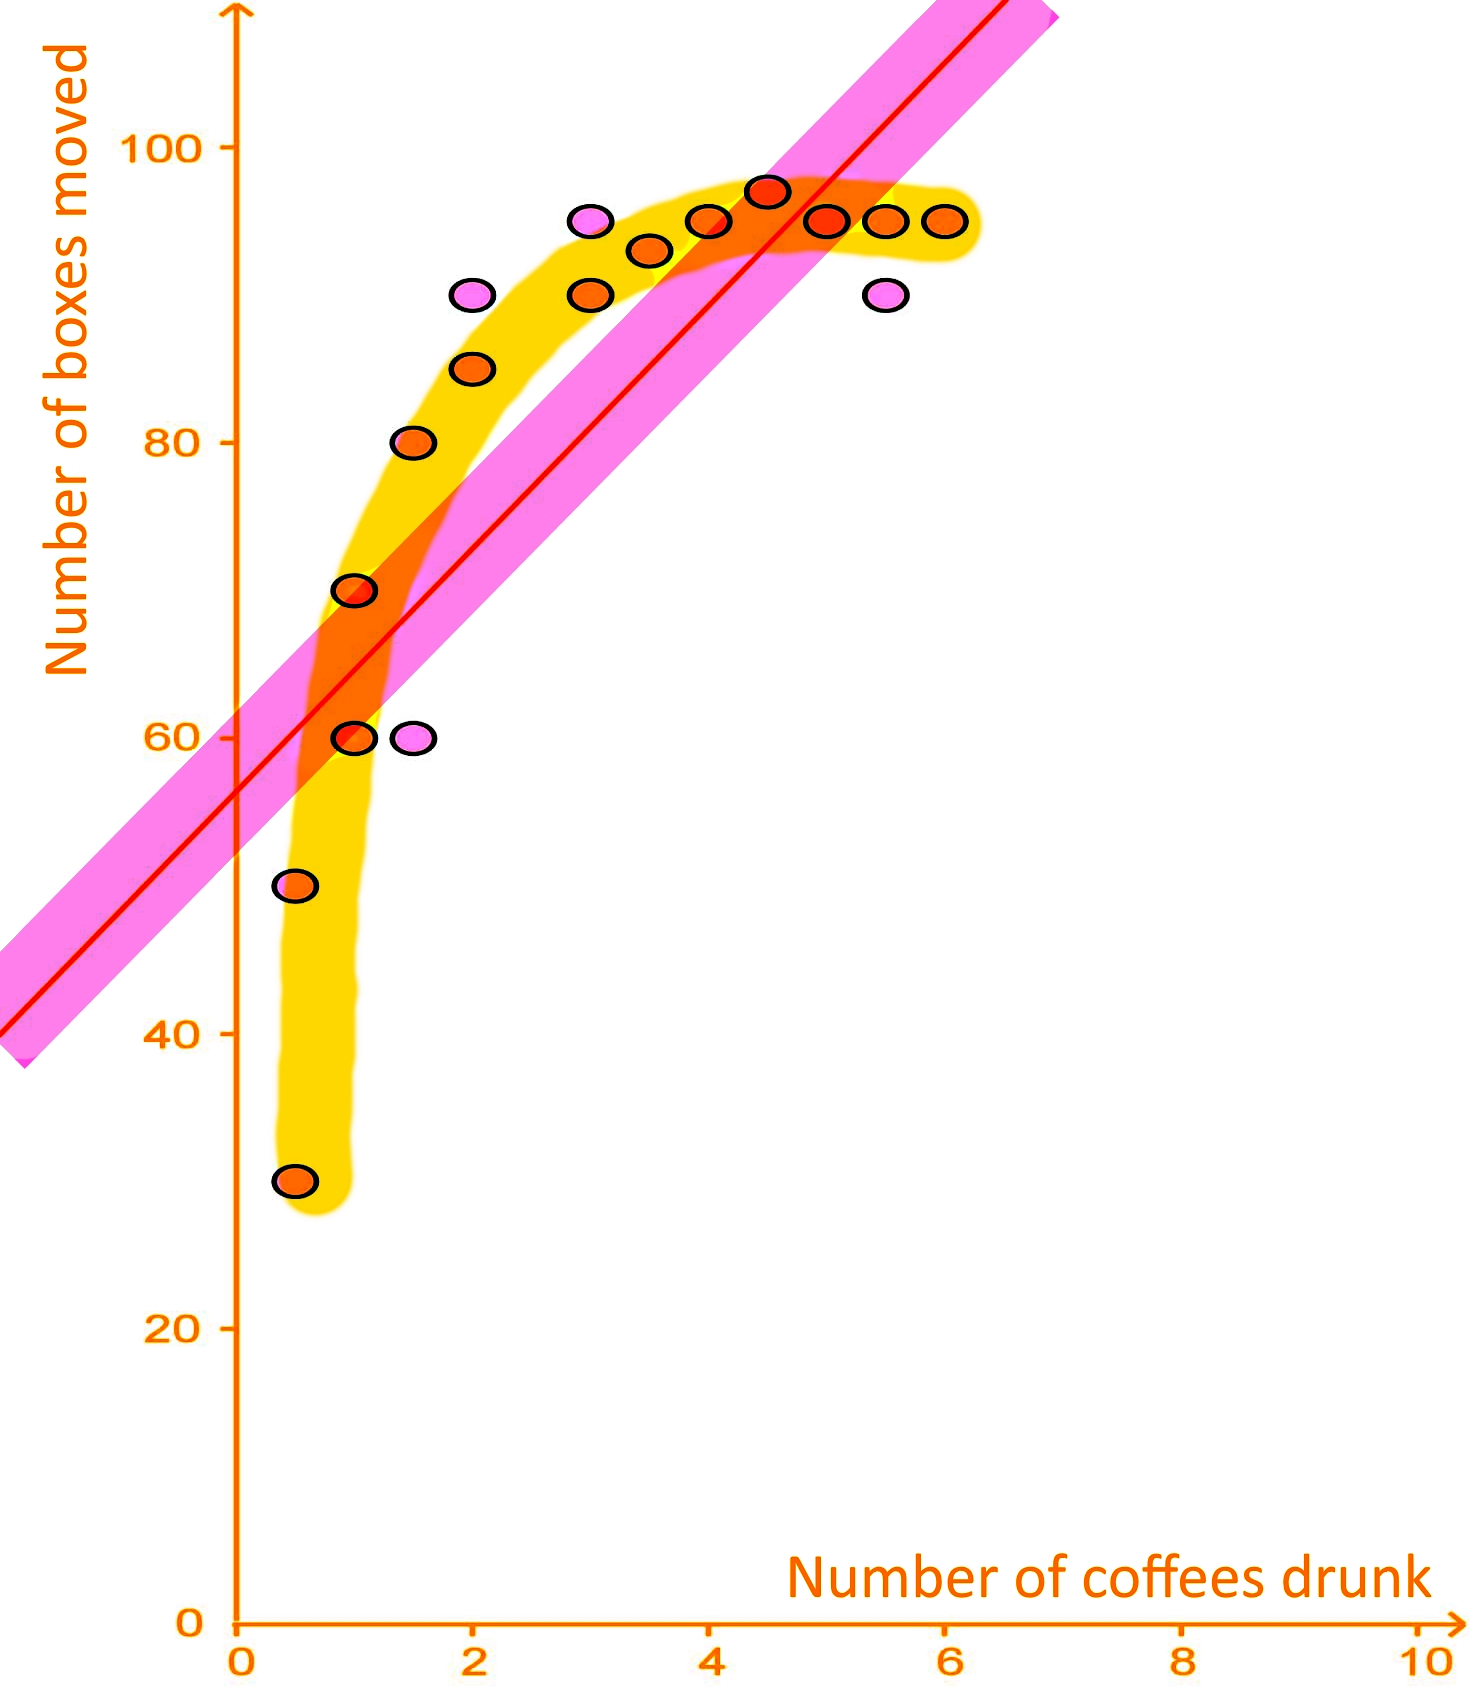
Since the data is dispersed non-uniformly and far away from the trend line (on the yellow shaded area), even when the trend line produces the best approximation, its estimate is not that good. In order to produce a good estimation from a data set using the equation for a trend line and interpolation, the data points should be uniformly dispersed near the trend line, as shown in the pink shaded area surrounding the trend line for this graph.
Example 3
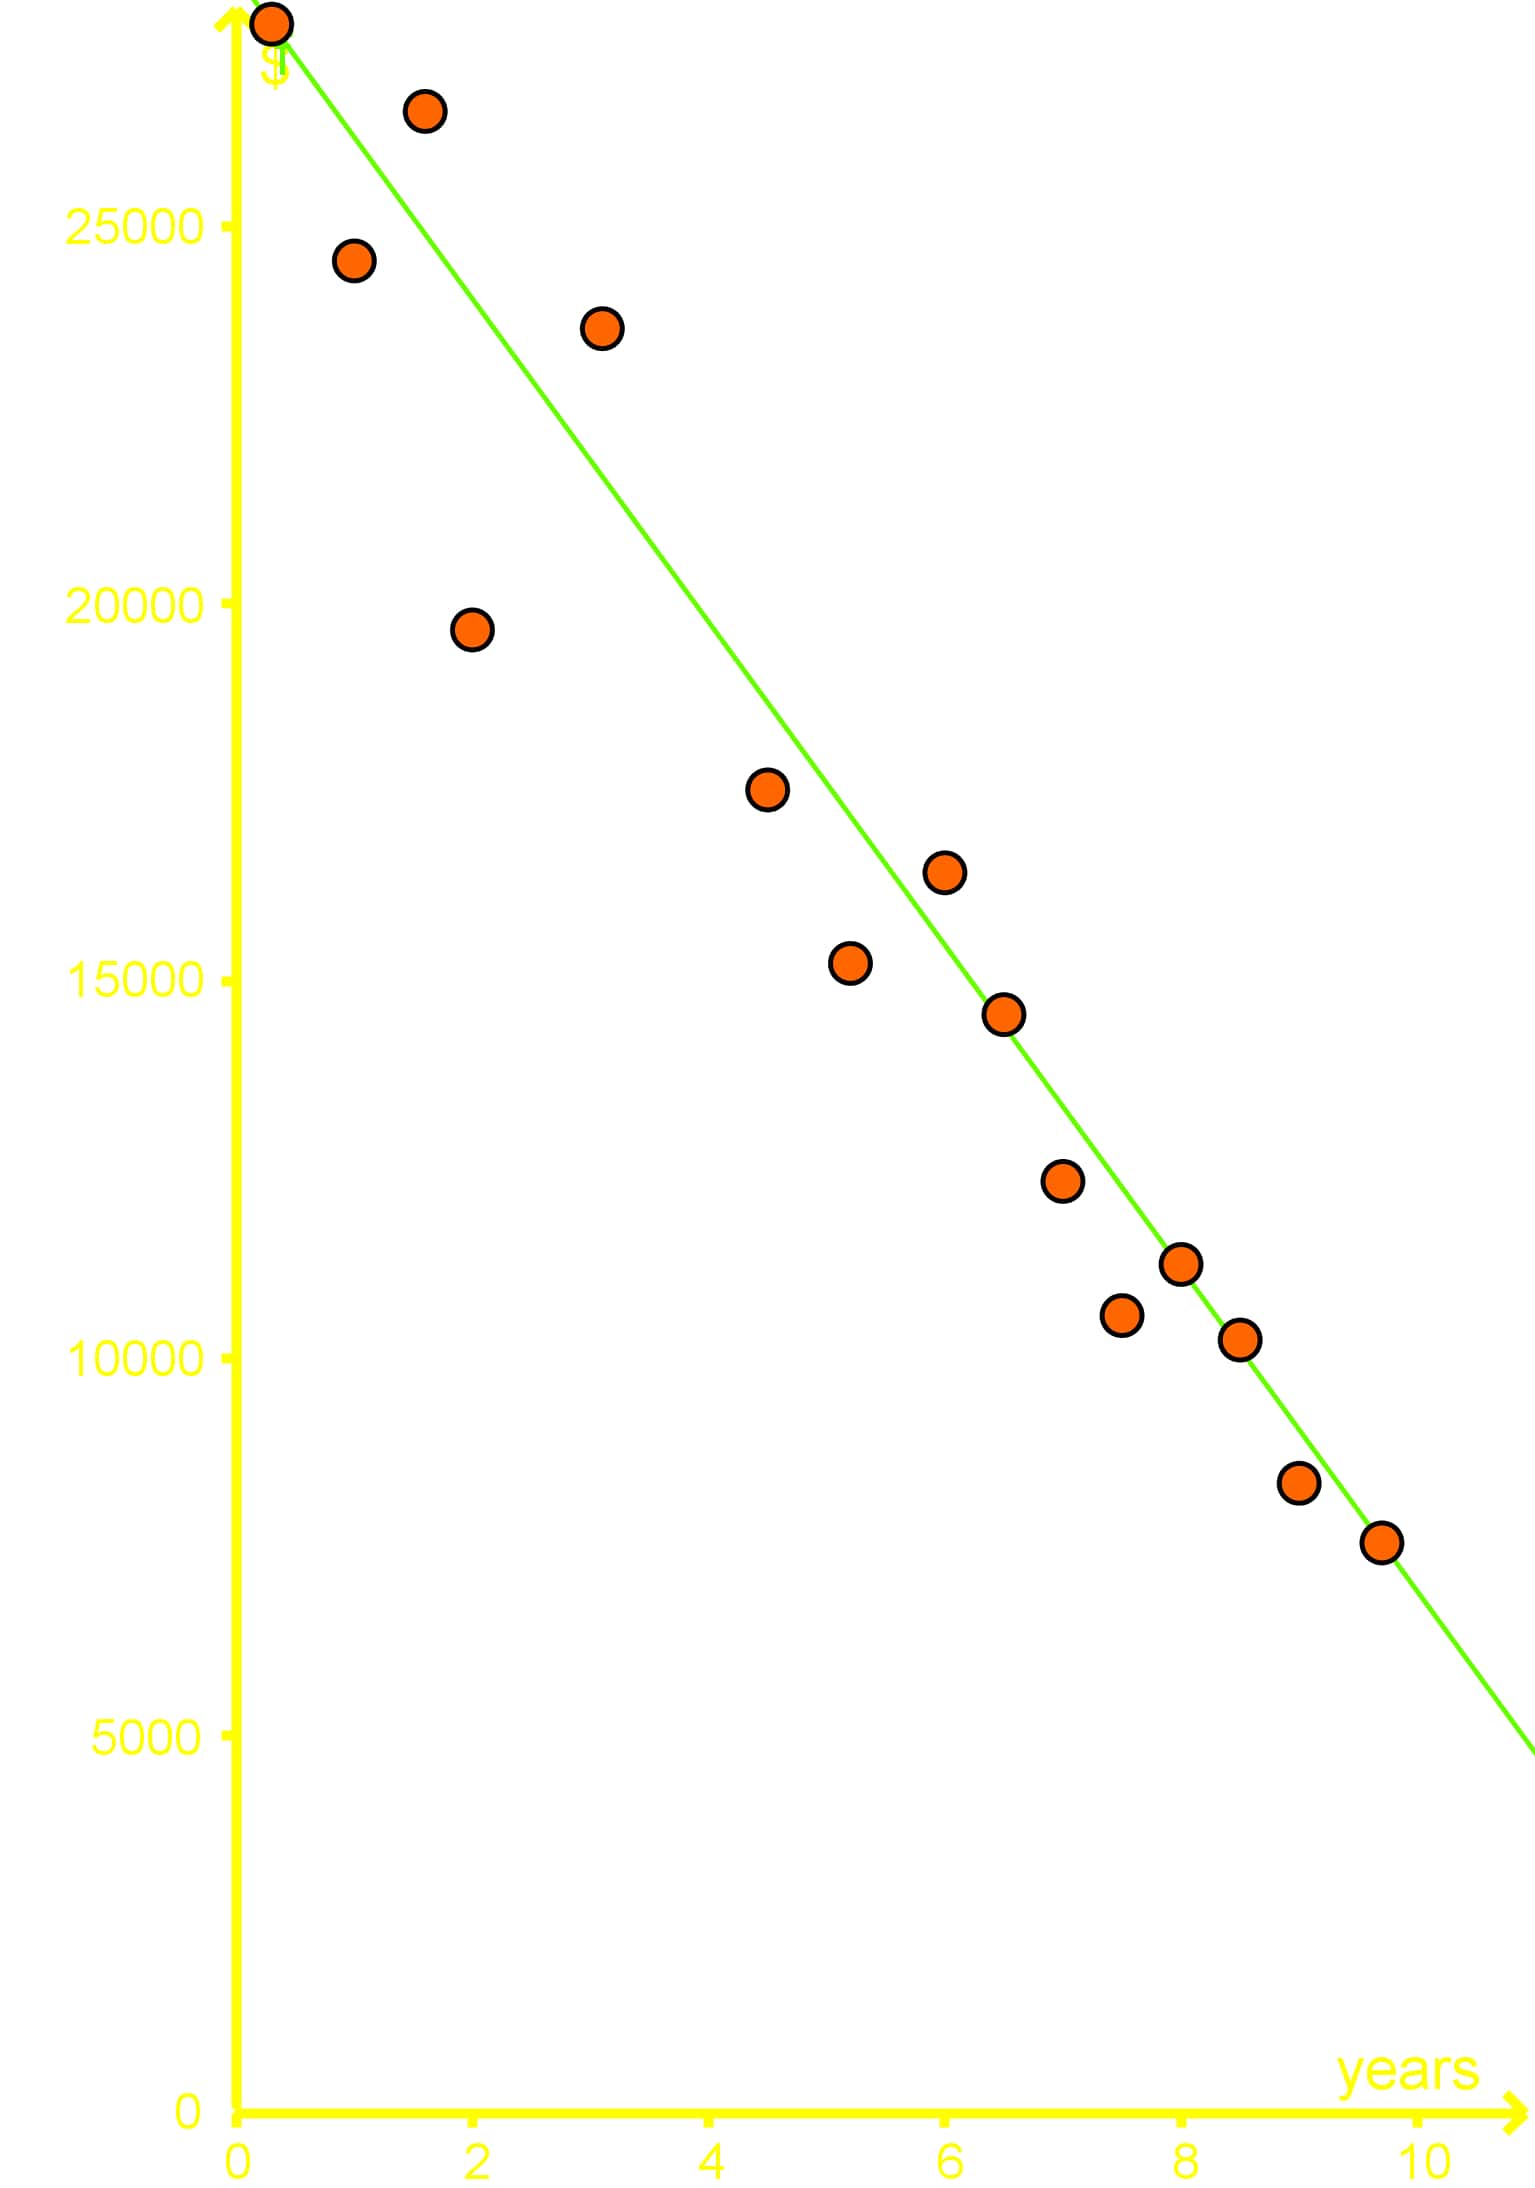
A study took a sample of 14 cars and found the age of each car and the amount of money that each car is worth. A best fit line is given by the equation , where is the worth of the car in dollars and is the age of the car in years.
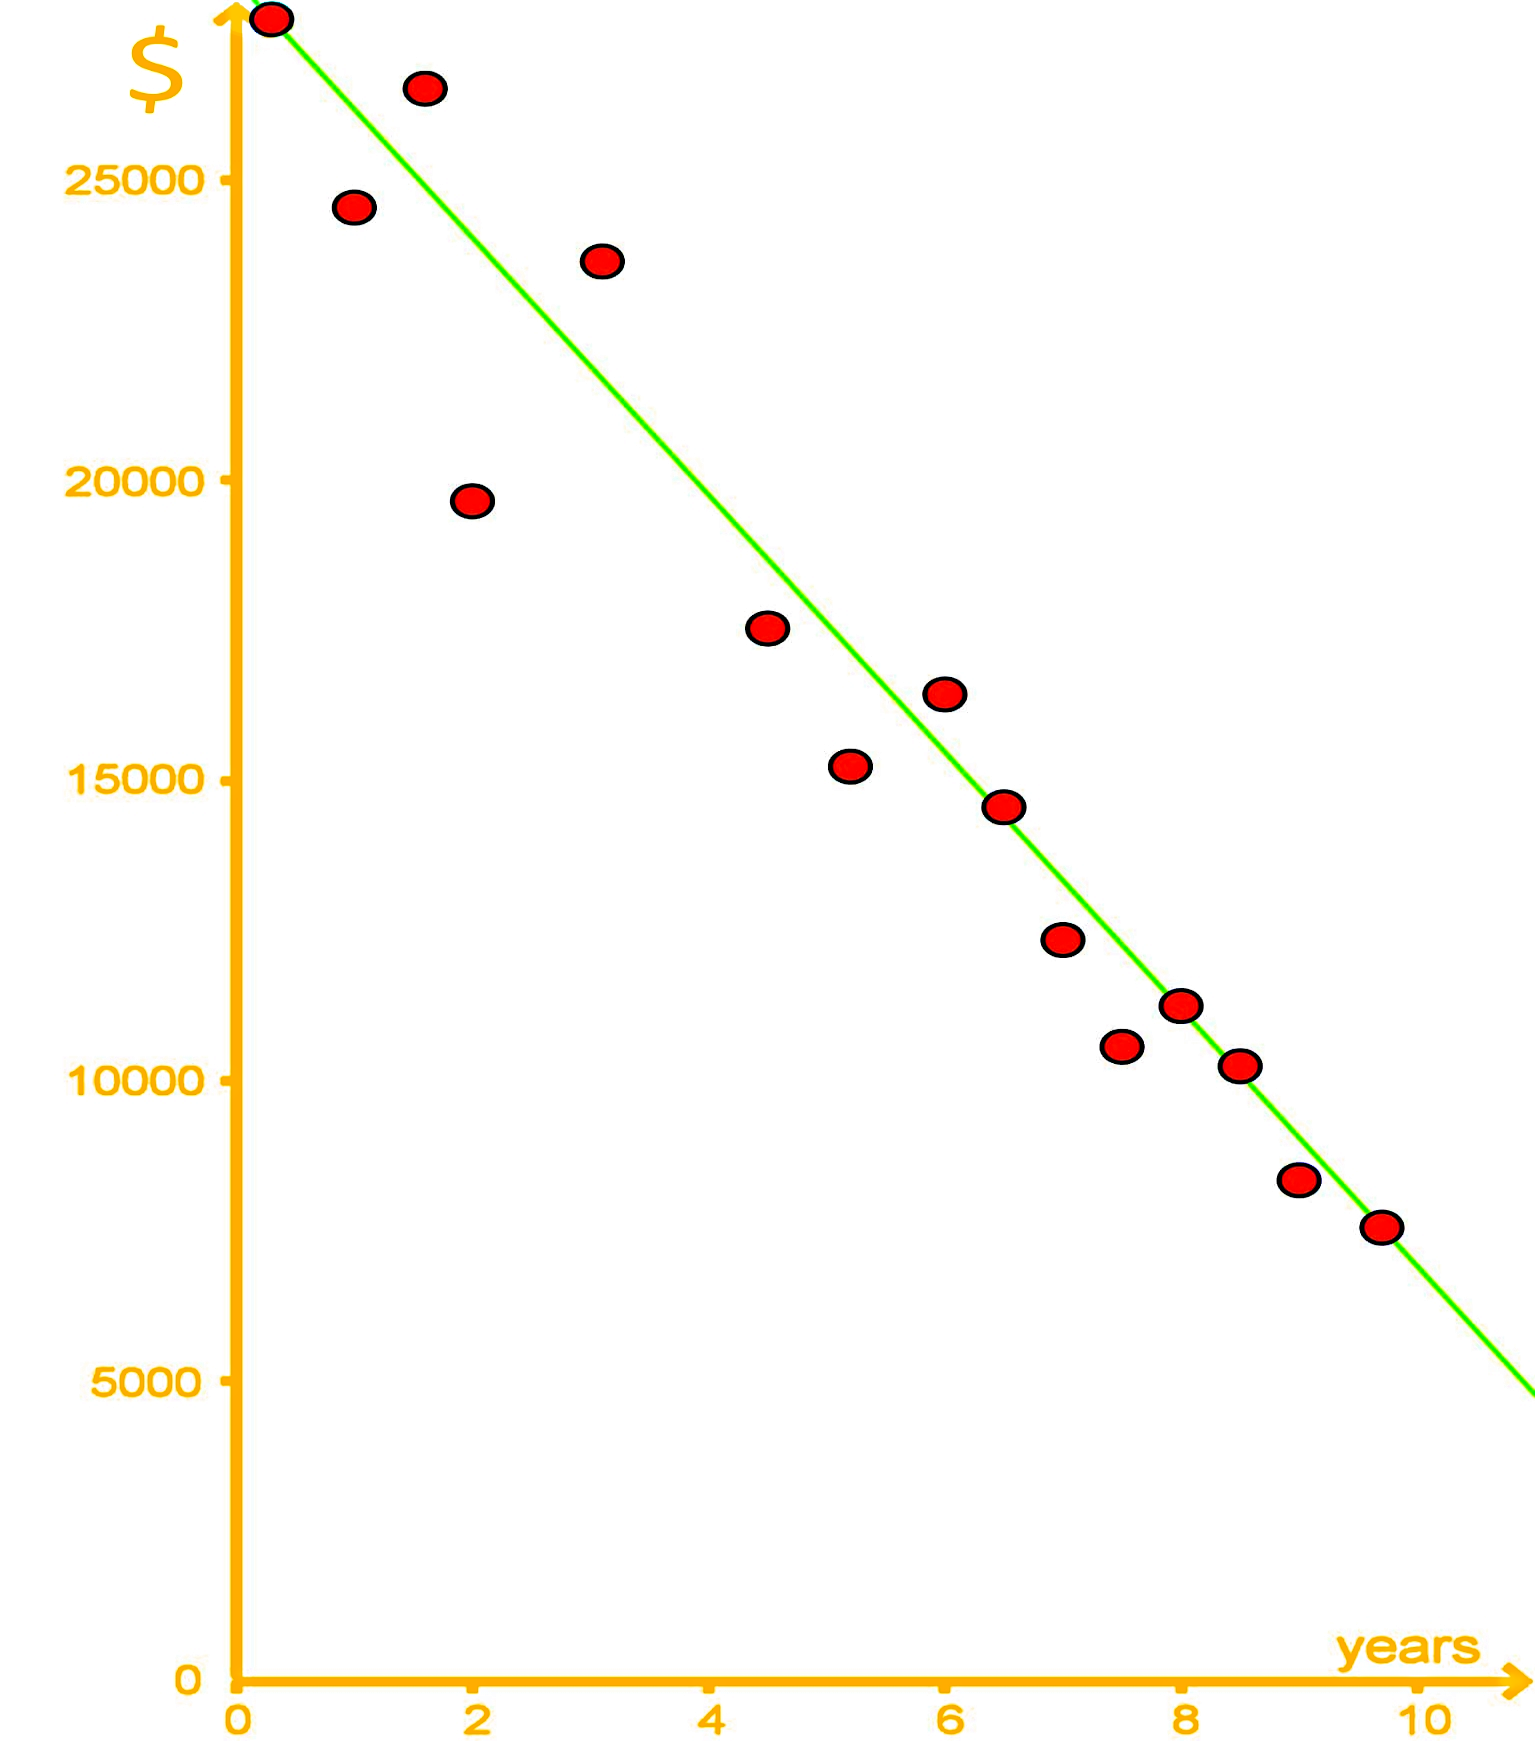
Using the equation for the best fit line provided above: .
We calculate the worth of the car () by substituting the age value () into the equation.
Since , then: .
And so, the net worth of a 5 year old car is $17,000.
When , then: .
Therefore, the net worth of an 11 year old car is $4,400.
When , then: .
According to this regression analysis, the net worth of an 11 year old car should be -$4,000.
So what is wrong with this answer? Well, the value of the car cannot be negative! This extrapolation decreases its accuracy as you continue to plot values because the real value would not continue in a linear tendency, just take a look at the graph below:
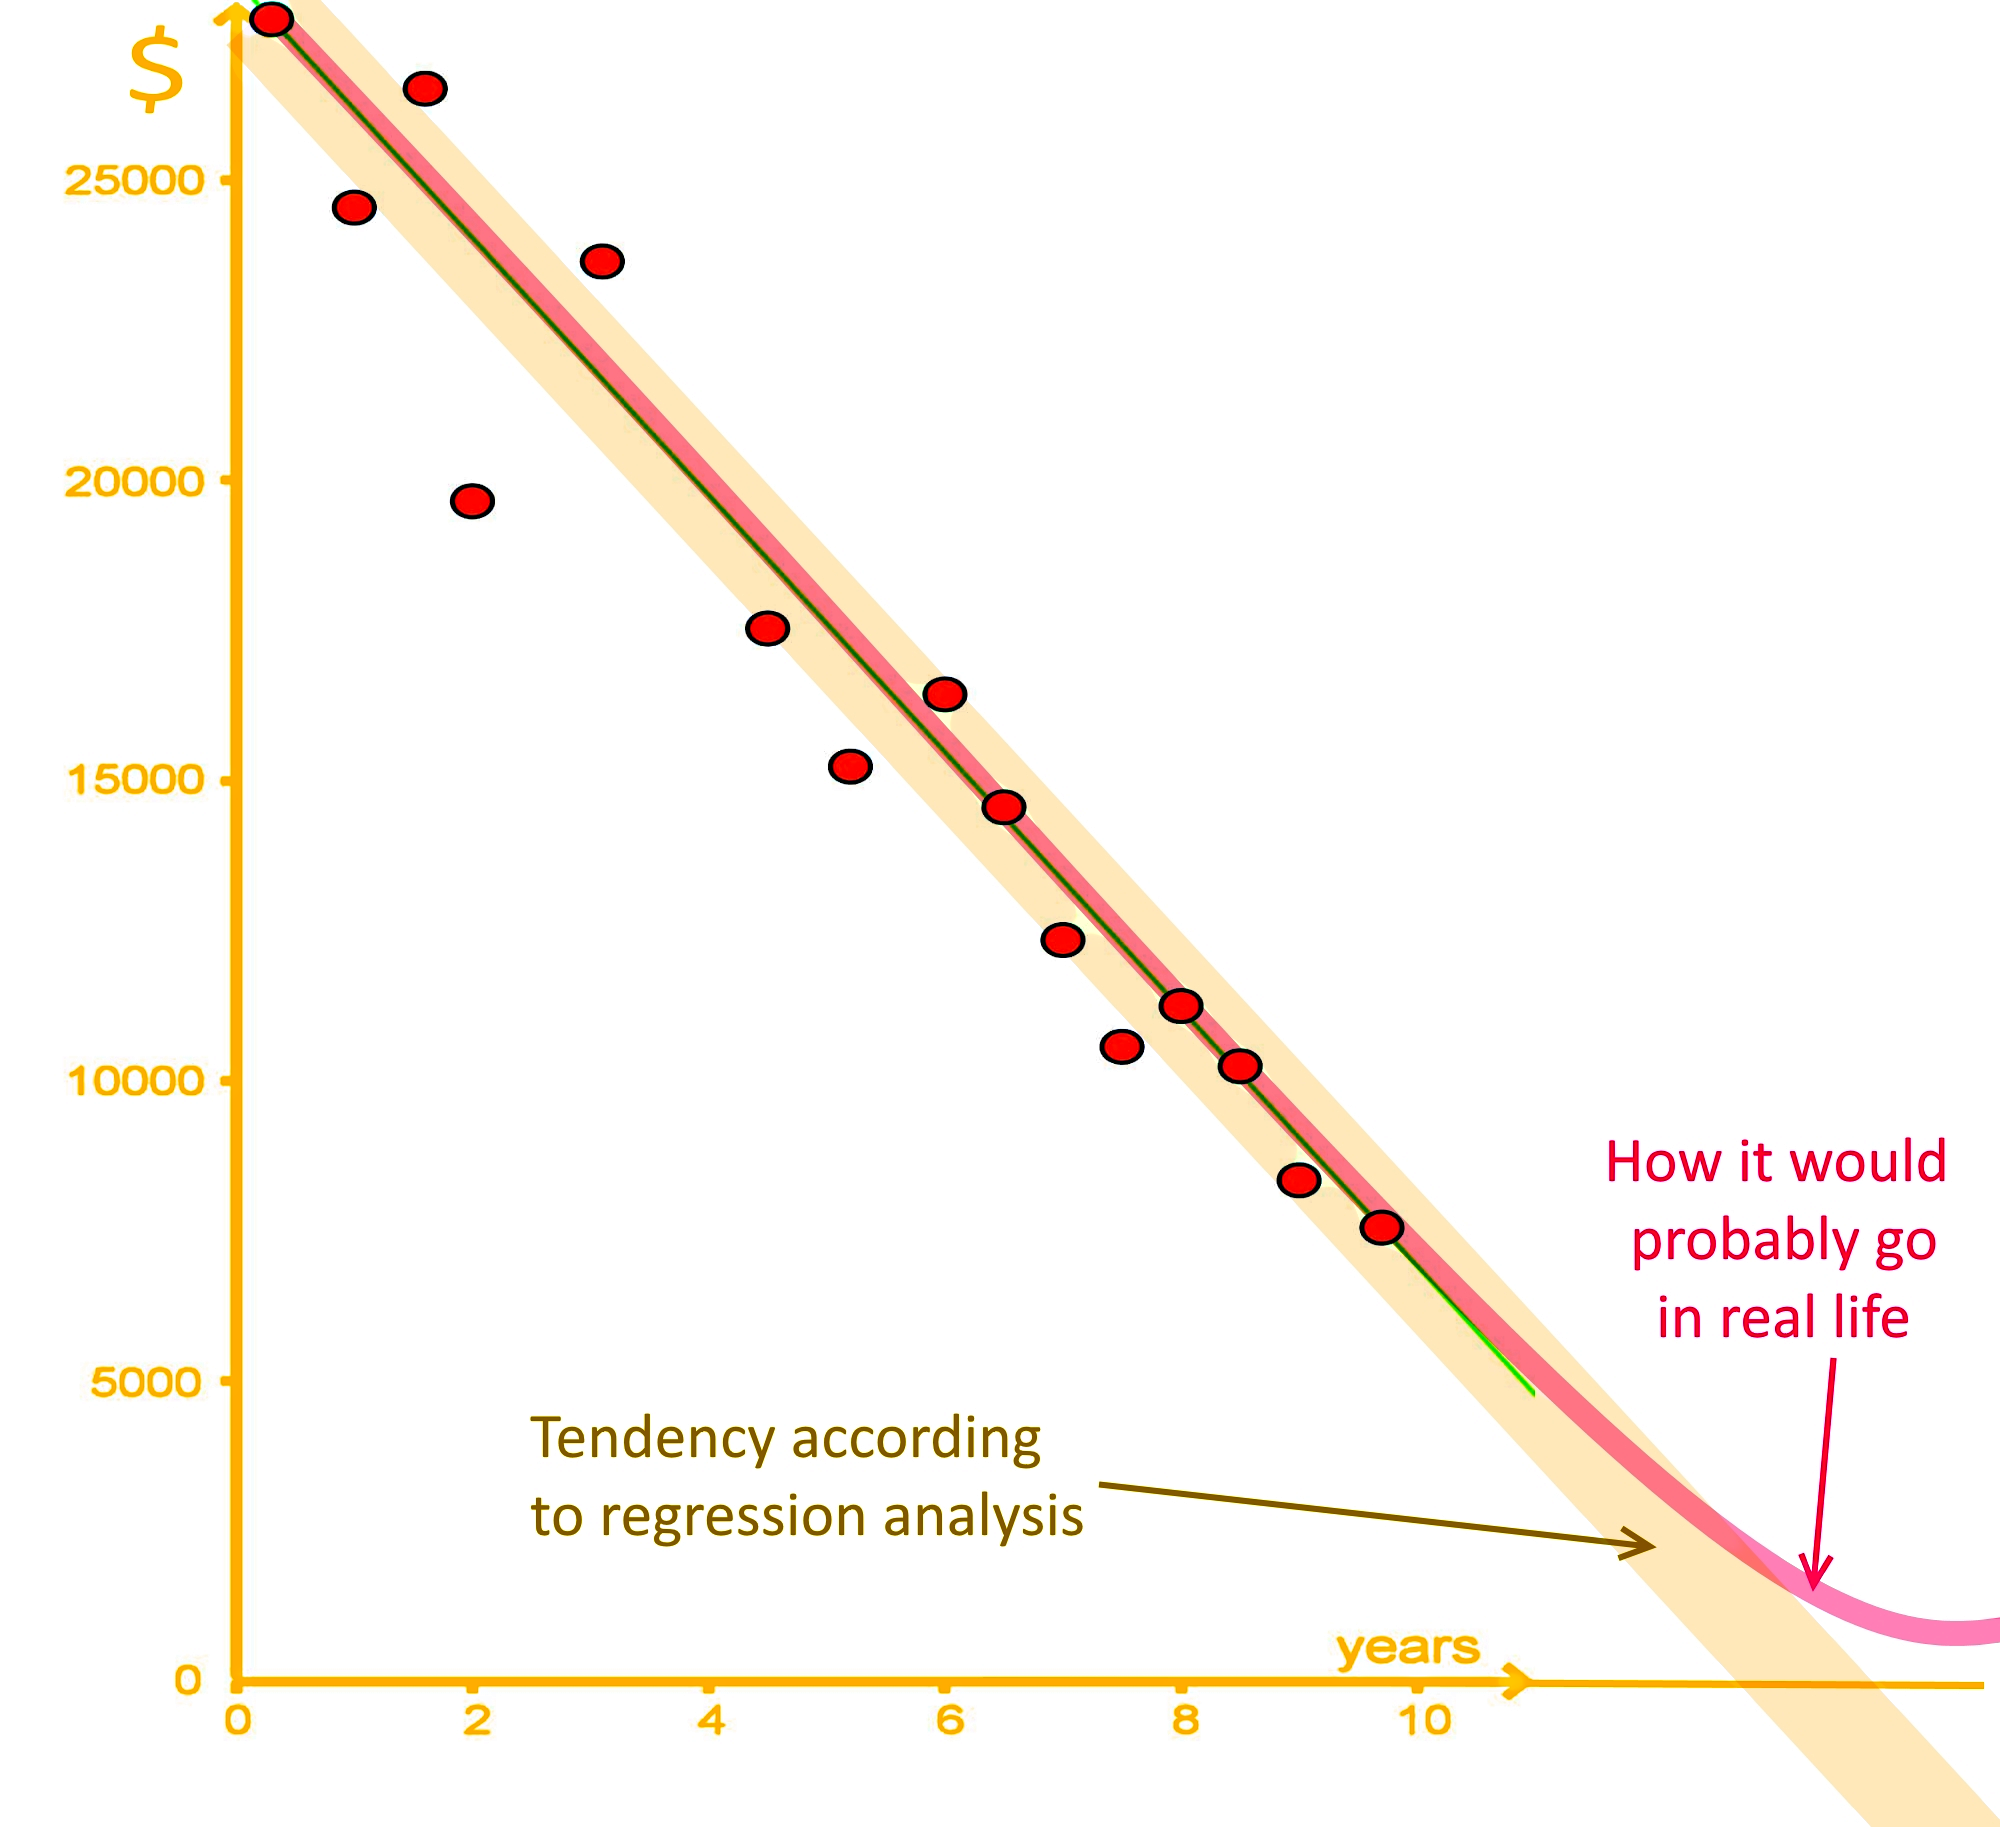
Although someone would argue that a negative number could, in a sense, be correct because as it ages, a car will make you spend more in repairs than what it is worth; we are only talking about the cars worth as a vehicle here (not the infinite variables that come from the owner and real life); therefore, a car is still worth something as it ages and you could sell it (even if its as scrap material haha!). Thus, this extrapolation result of -$4,000 is not a good estimate.
To end this lesson, here are a few link recommendations for you: On this introduction to correlation and regression analysis you will see how this and our past lesson come together once more, pay close attention to the different examples provided; furthermore, this article covers an example of the multivariate regression analysis, which is an expansion of what we have seen so far.
This is it for our lesson of today, see you in the next one!
• The simplest model for regression analysis is a "line of best fit" or a "trend line"
• Interpolation is our estimation of finding a new data point that lies within our known set of data points.
• Extrapolation is our estimation of a new data point that lies outside our known set of data points.