Delaware
Join 12,000+ Delaware students building confidence in Statistics
Why Statistics Students Choose StudyPug
Three ways you get help — even when you’re stuck
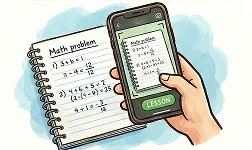
Search with Photo
Snap a photo of any problem and get the exact lesson
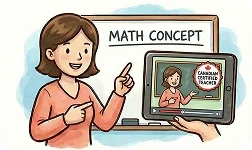
Expert Video Teaching
Certified teachers explain every concept with clear examples

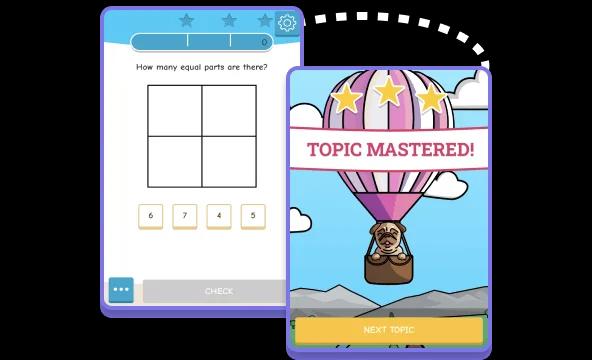
Unlimited Practice
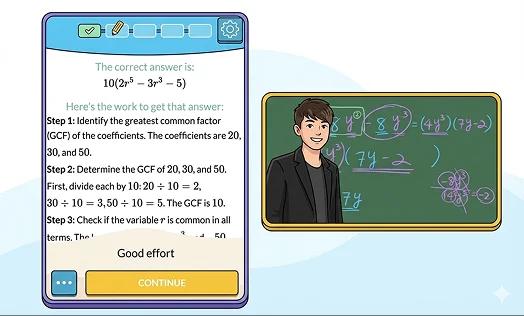
Thousands of practice questions with step-by-step solutions
How StudyPug Works for You
1
Pick Your Course
Choose Statistics and see every topic from your class
2

Get Unstuck
Upload homework problems or browse curriculum-aligned lessons.
3
Practice & Master
Work through similar problems until concepts stick.
4
See Results
Track exactly what you've mastered.
Delaware Statistics Course | Master Stats with StudyPugHelp
ID | Standard | StudyPug Topic |
|---|---|---|
CC.HSS.ID.A.1 | Represent data with plots on the real number line (dot plots, histograms, and box plots). |
CC.HSS.ID.A.2 | Use statistics appropriate to the shape of the data distribution to compare center (median, mean) and spread (interquartile range, standard deviation) of two or more different data sets. |
CC.HSS.ID.A.3 | Interpret differences in shape, center, and spread in the context of the data sets, accounting for possible effects of extreme data points (outliers). |
CC.HSS.ID.A.4 | Use the mean and standard deviation of a data set to fit it to a normal distribution and to estimate population percentages. Recognize that there are data sets for which such a procedure is not appropriate. Use calculators, spreadsheets, and tables to estimate areas under the normal curve. |
CC.HSS.ID.B.5 | Summarize categorical data for two categories in two-way frequency tables. Interpret relative frequencies in the context of the data (including joint, marginal, and conditional relative frequencies). Recognize possible associations and trends in the data. |
CC.HSS.ID.B.6 | Represent data on two quantitative variables on a scatter plot, and describe how the variables are related. |
CC.HSS.IC.A.1 | Understand statistics as a process for making inferences about population parameters based on a random sample from that population. |
CC.HSS.IC.A.2 | Decide if a specified model is consistent with results from a given data-generating process, e.g., using simulation. |
CC.HSS.IC.B.3 | Recognize the purposes of and differences among sample surveys, experiments, and observational studies; explain how randomization relates to each. |
CC.HSS.IC.B.4 | Use data from a sample survey to estimate a population mean or proportion; develop a margin of error through the use of simulation models for random sampling. |
CC.HSS.IC.B.5 | Use data from a randomized experiment to compare two treatments; use simulations to decide if differences between parameters are significant. |
CC.HSS.IC.B.6 | Evaluate reports based on data. |
CC.HSS.CP.A.2 | Understand that two events A and B are independent if the probability of A and B occurring together is the product of their probabilities, and use this characterization to determine if they are independent. |
CC.HSS.CP.A.3 | Understand the conditional probability of A given B as P(A and B)/P(B), and interpret independence of A and B as saying that the conditional probability of A given B is the same as the probability of A, and the conditional probability of B given A is the same as the probability of B. |
CC.HSS.CP.A.5 | Recognize and explain the concepts of conditional probability and independence in everyday language and everyday situations. |
CC.HSS.CP.B.7 | Apply the Addition Rule, P(A or B) = P(A) + P(B) - P(A and B), and interpret the answer in terms of the model. |
CC.HSS.CP.B.9 | Use permutations and combinations to compute probabilities of compound events and solve problems. |
CC.HSS.MD.A.1 | Define a random variable for a quantity of interest by assigning a numerical value to each event in a sample space; graph the corresponding probability distribution using the same graphical displays as for data distributions. |
CC.HSS.MD.A.2 | Calculate the expected value of a random variable; interpret it as the mean of the probability distribution. |
CC.HSS.MD.A.3 | Develop a probability distribution for a random variable defined for a sample space in which theoretical probabilities can be calculated; find the expected value. |
CC.HSS.MD.B.7 | Analyze decisions and strategies using probability concepts (e.g., product testing, medical testing, pulling a hockey goalie at the end of a game). |
Complete Statistics Coverage
Topics
42
Video Lessons
335
Practice Questions
416
Student Success Rate
94%
Why Delaware Statistics Students Love StudyPug
Built specifically for Delaware high school success
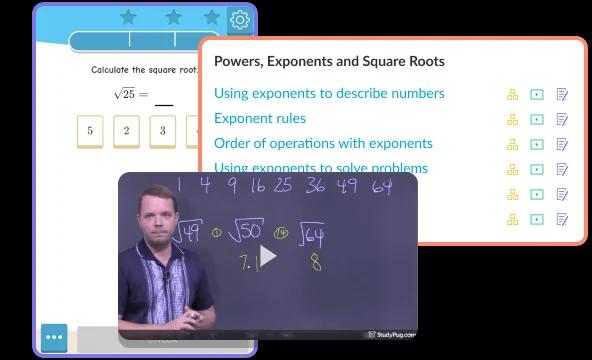
Delaware Curriculum Aligned
Every lesson matches Delaware Statistics standards—what you learn in class, we teach
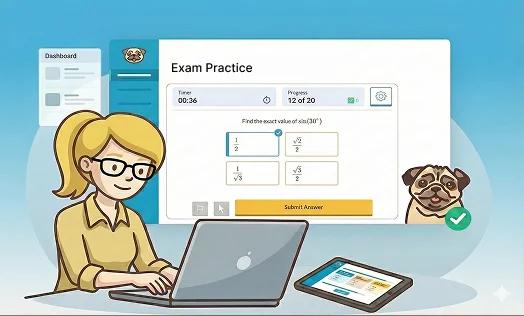
Graduation Assessment Prep
Practice with Delaware graduation assessment questions—be ready for exam day

Certified Teachers
Learn from expert Delaware teachers who know exactly what you need for Statistics
Learn Anywhere
Desktop, tablet, or phone—your Statistics lessons sync across all devices
Statistics Questions Answered
Everything you need to know about mastering Statistics with StudyPug
What does Statistics coverage include?
Our Statistics course covers all essential topics: descriptive statistics (mean, median, mode, standard deviation), probability theory, conditional probability, sampling methods, confidence intervals, hypothesis testing, binomial and normal distributions, correlation, and regression. Every lesson aligns with Delaware standards and includes video explanations plus practice problems.
How does photo search work?
Snap a photo of any Statistics problem from your homework or textbook. Our AI instantly identifies the problem type and shows you the exact video lesson you need. It works with probability problems, hypothesis testing questions, distribution calculations, and more. No more searching through topics—just point, click, and learn.
How many Statistics practice problems are available?
You get access to 477 practice questions covering every Statistics topic, from basic descriptive statistics to advanced hypothesis testing. Each question includes step-by-step solutions. Practice as many times as you need—questions adapt to your level and help you master concepts through repetition and feedback.
What if I'm falling behind in Statistics?
Start with our diagnostic to identify exactly where you need help. Watch video lessons at your own pace, pause and rewind as needed. Practice similar problems until concepts click. Our adaptive practice ensures you build a strong foundation before moving to harder topics. Most students see improvement within 2-3 weeks of consistent practice.
Does StudyPug help with Statistics exams?
Yes. We provide comprehensive exam prep including practice tests, review lessons for every major topic, and step-by-step problem-solving strategies. Our content aligns with Delaware graduation assessments and AP Statistics if you're taking it. Students use StudyPug to prepare for midterms, finals, and standardized tests with confidence.
How much does StudyPug cost?
Plans start at $13.32/month with our annual subscription. You get unlimited access to all Statistics lessons, practice questions, and features including photo search and progress tracking. Try it free—no credit card required. Cancel anytime if it's not right for you. Most students find it's more affordable and flexible than traditional tutoring.
Smart Study Tools for Real Results
Personalized features that help you stay motivated and make progress
Adaptive Practice
Questions adapt to your level
Stay Motivated
Badges and streaks keep you practising daily
Quiz Mastery
Retake quizzes until you truly get it
Progress Tracking
See exactly where you need more practice