Reading and drawing histograms
All You Need in One PlaceEverything you need for Year 6 maths and science through to Year 13 and beyond. | Learn with ConfidenceWe’ve mastered the national curriculum to help you secure merit and excellence marks. | Unlimited HelpThe best tips, tricks, walkthroughs, and practice questions available. |
Make math click 🤔 and get better grades! 💯Join for Free
Intros
Examples
Lessons
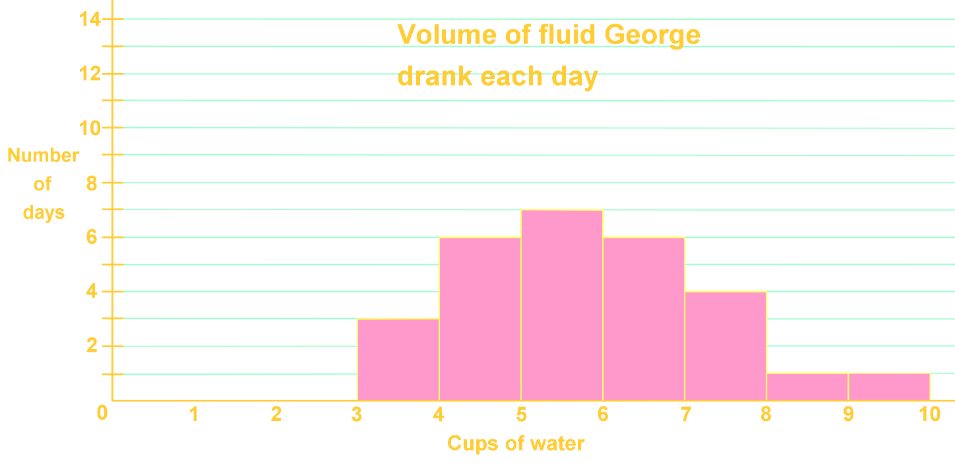
- The histogram shows the volume of fluid George drank each day.
- The frequency table below shows the amount of time spent outdoors each day on average for students in a kindergarten class.
Minutes spent outdoor
Number of days
1-9
4
10-19
5
20-29
3
30-39
2
40-49
1
50-59
2
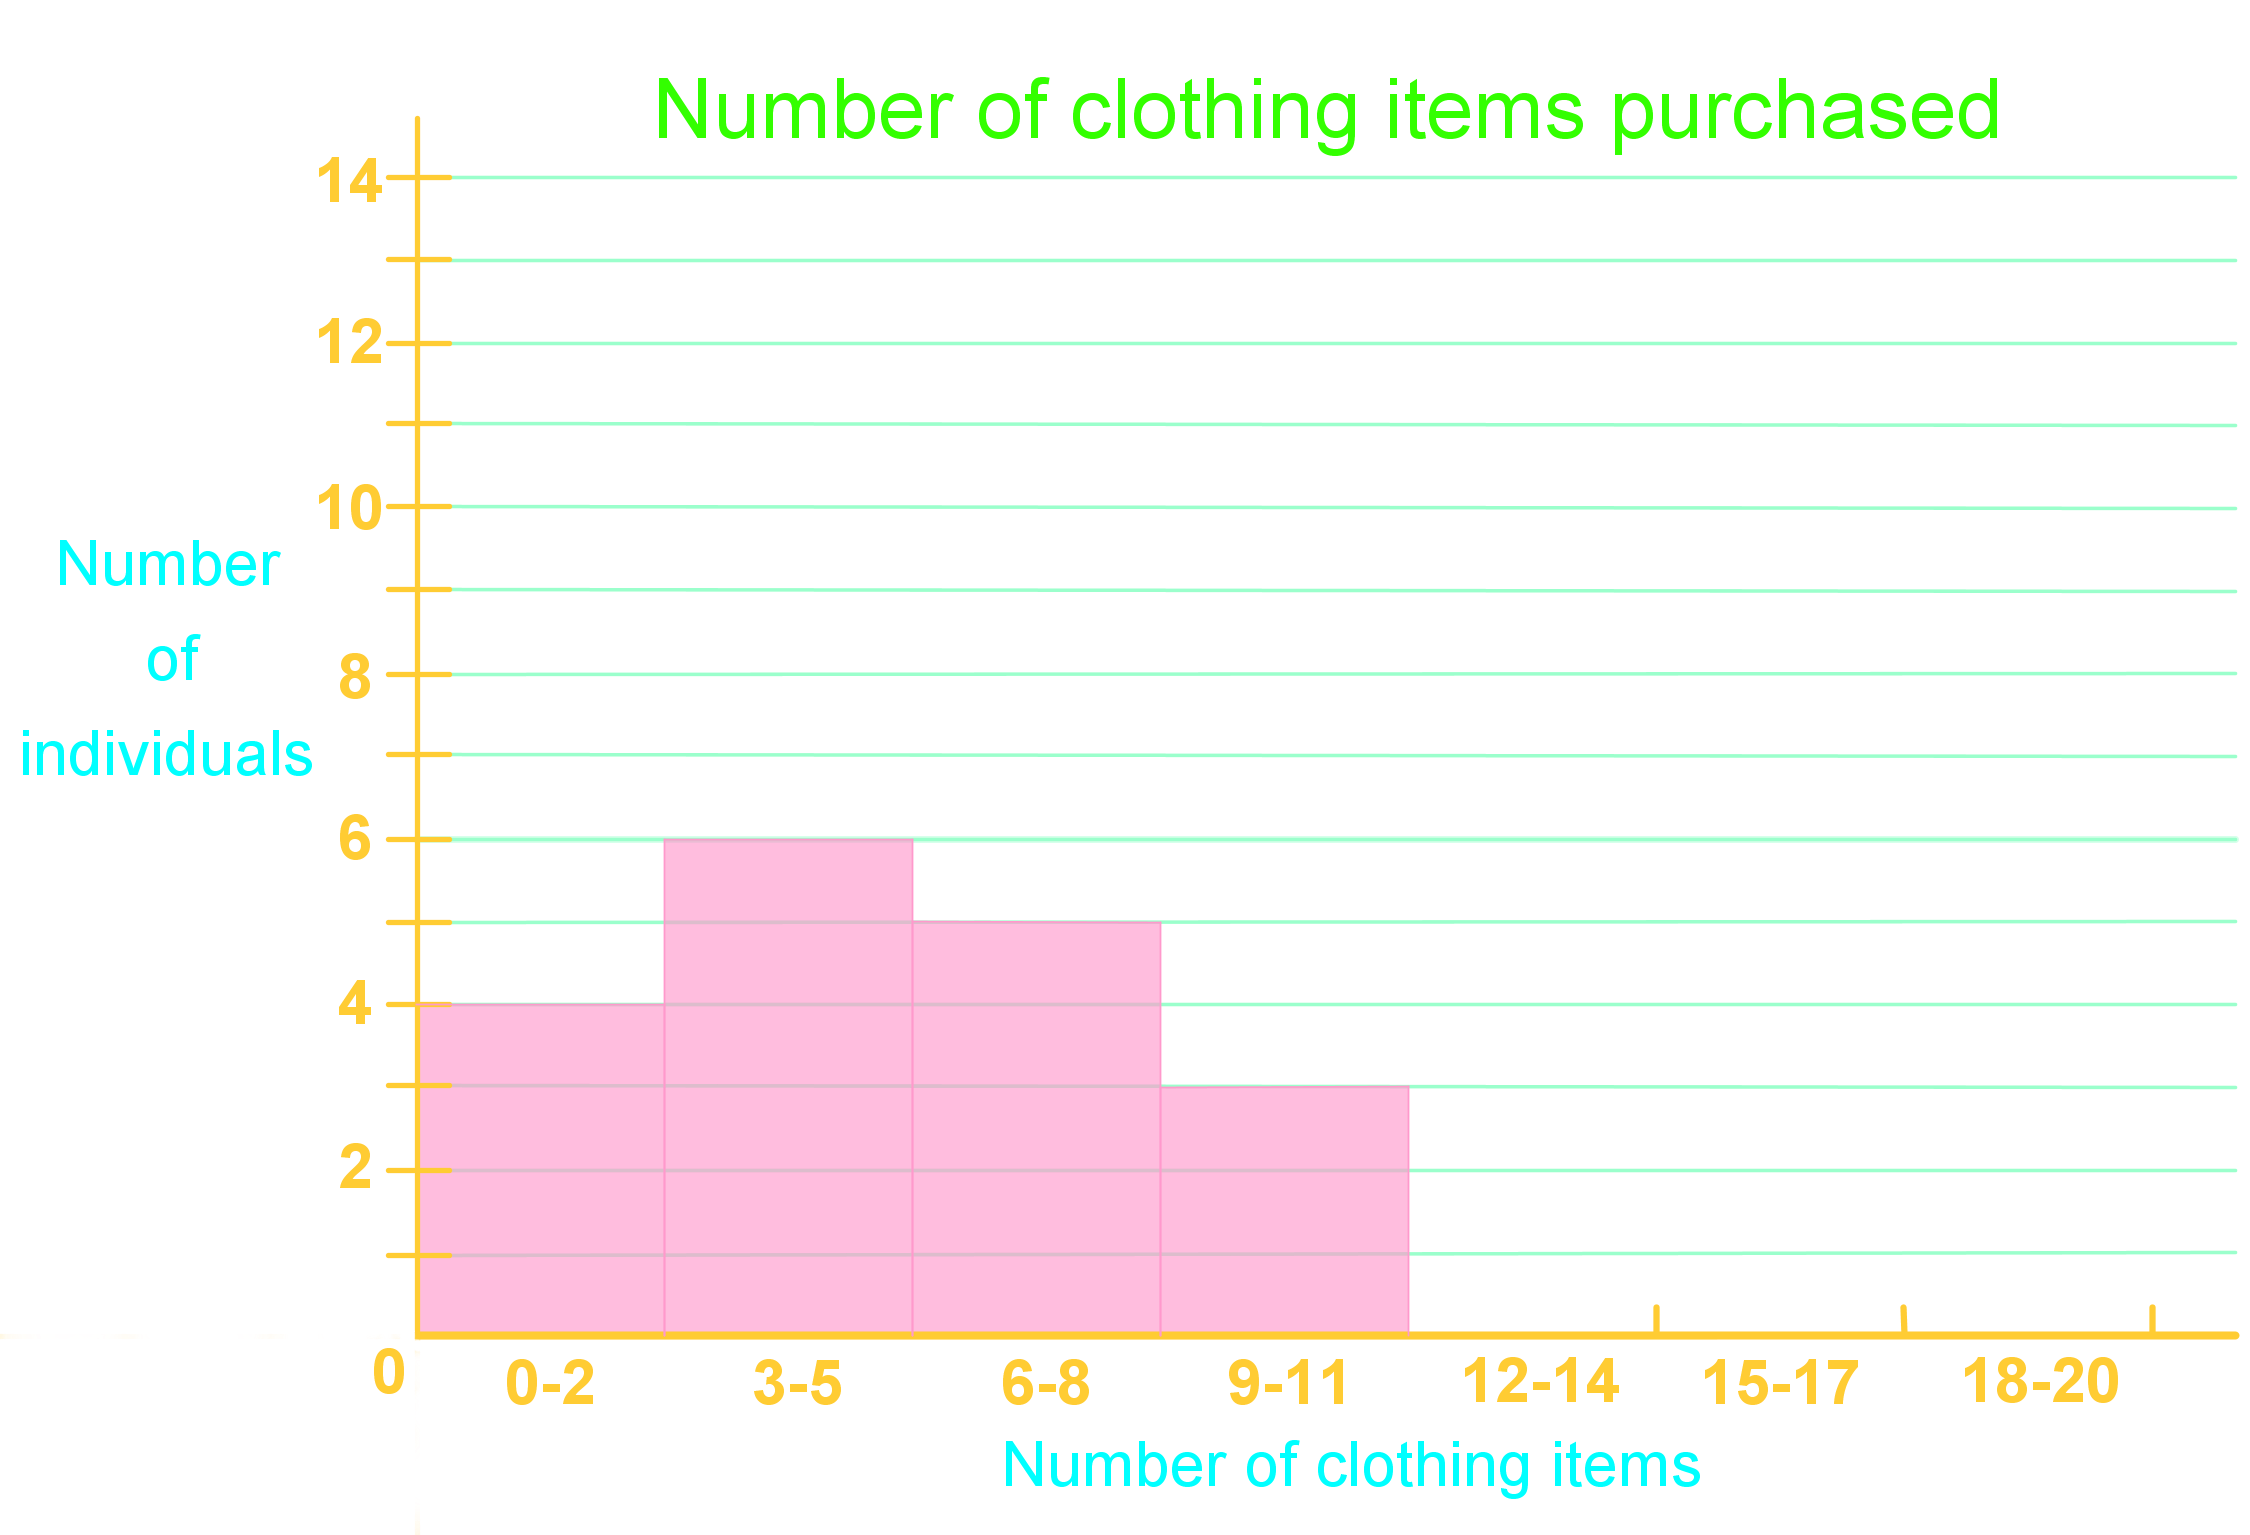
- A survey was done to look at the number of clothing items people purchased in the last 3 years. Below is the data collected:
9, 4, 18, 3, 8, 1, 0, 5, 16, 10, 7, 8, 2, 12, 7, 11, 3, 5, 4, 13, 20, 6, 13, 1