Representing patterns in linear relations
All in One PlaceEverything you need for better grades in university, high school and elementary. | Learn with EaseMade in Canada with help for all provincial curriculums, so you can study in confidence. | Instant and Unlimited HelpGet the best tips, walkthroughs, and practice questions. |
Make math click 🤔 and get better grades! 💯Join for Free
0/13
Examples
Lessons
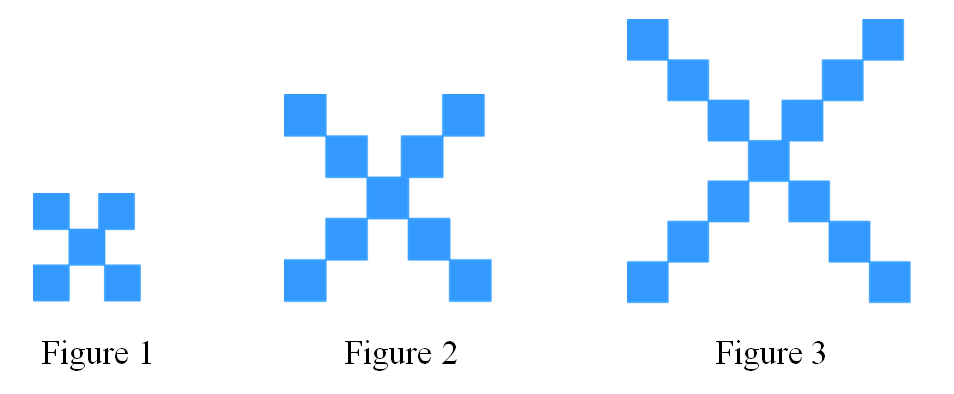
- Create a table that shows the relationship between the number of squares and the figure number.
- Determine the equation that represents the relationship.
- Use the equation in b) to find the number of squares in each figure.
- How many squares will there be in figure 14?
- Determine which figure has 84 squares.
- Two identical octagons are attached to each other. All the sides in each octagon have the same length.

- Create a table that shows the number of sides if there are 2,3,4,5 or 6 octagons attached together. Assume each new octagon only attaches to one additional octagon.
- Write an equation to calculate the number of sides based on the number of octagons attached together.
- How many sides will there be when 15 octagons are attached together?
- If there are 84 sides in total, how many octagons are attached together?
- Write the linear equation that represents the relationship of each set of numbers.
0%


