Reflection across the x-axis: y = -f(x)
Everything You Need in One PlaceHomework problems? Exam preparation? Trying to grasp a concept or just brushing up the basics? Our extensive help & practice library have got you covered. | Learn and Practice With EaseOur proven video lessons ease you through problems quickly, and you get tonnes of friendly practice on questions that trip students up on tests and finals. | Instant and Unlimited HelpOur personalized learning platform enables you to instantly find the exact walkthrough to your specific type of question. Activate unlimited help now! |
Make math click 🤔 and get better grades! 💯Join for Free
Get the most by viewing this topic in your current grade. Pick your course now.
Intros
Examples


Topic Notes
Reflection Across the X-Axis
Before we get into reflections across the y-axis, make sure you've refreshed your memory on how to do simple vertical and horizontal translations.
How to Reflect Over X-Axis:
One of the most basic transformations you can make with simple functions is to reflect it across the x-axis or another horizontal axis. In a potential test question, this can be phrased in many different ways, so make sure you recognize the following terms as just another way of saying "perform a reflection across the x-axis":
1) Graph
2) Graph
3) Reflect over axis
In order to do this, the process is extremely simple: For any function, no matter how complicated it is, simply pick out easy-to-determine coordinates, divide the y-coordinate by (-1), and then re-plot those coordinates. That's it!
The best way to practice drawing reflections across the y-axis is to do an example problem:
Example:
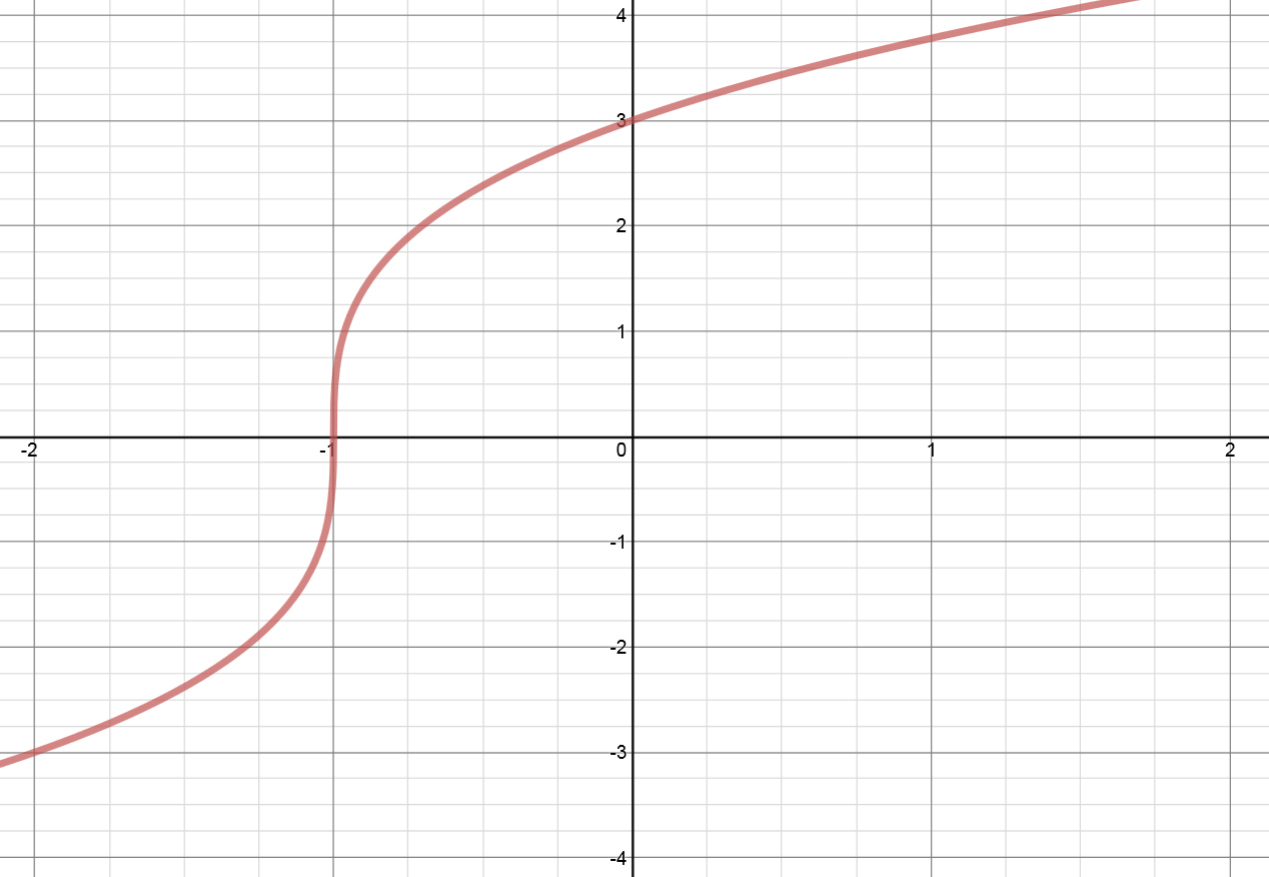
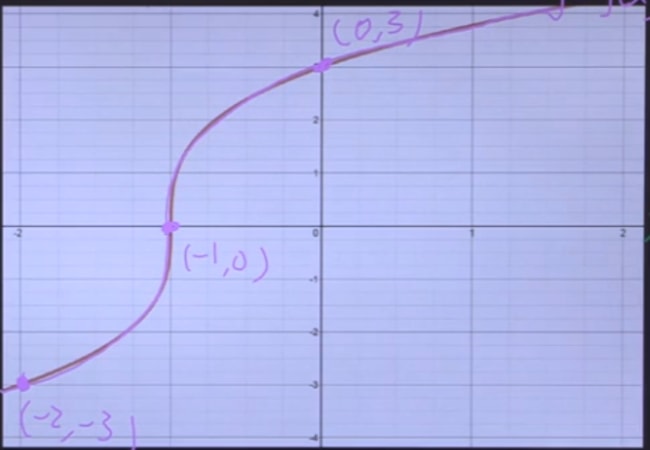
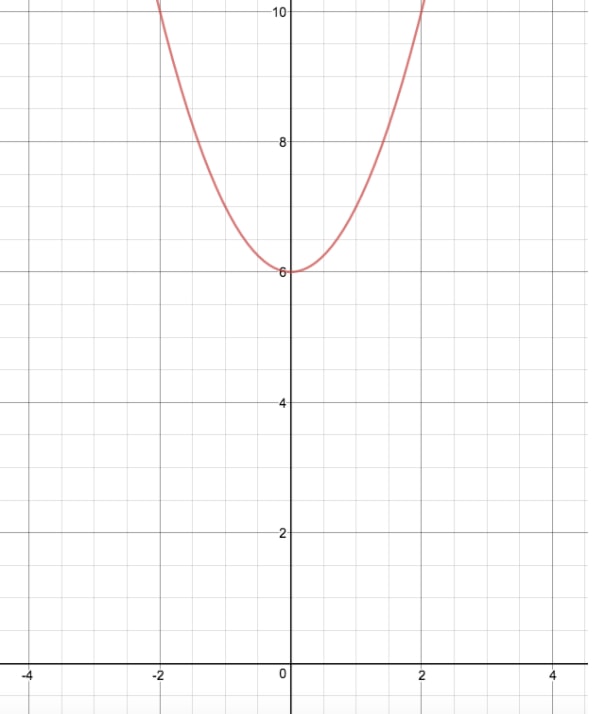
Given the graph of as shown, sketch .
Remember, the only step we have to do before plotting the reflection is simply divide the y-coordinates of easy-to-determine points on our graph above by (-1). When we say "easy-to-determine points" what this refers to is just points for which you know the x and y values exactly. Don't pick points where you need to estimate values, as this makes the problem unnecessarily hard. Below are several images to help you visualize how to solve this problem.
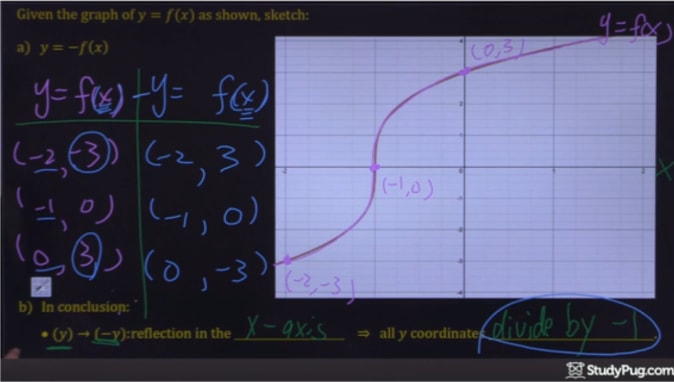
Step 1: Know that we're reflecting across the x-axis
Since we were asked to plot the – reflection, is it very important that you recognize this means we are being asked to plot the reflection over the x-axis. When drawing reflections across the and axis, it is very easy to get confused by some of the notations. So, make sure you take a moment before solving any reflection problem to confirm you know what you're being asked to do.
Step 2: Identify easy-to-determine points
Remember, pick some points (3 is usually enough) that are easy to pick out, meaning you know exactly what the x and y values are. In this case, let's pick (-2 ,-3), (-1 ,0), and (0,3).
Step 3: Divide these points by (-1)
While the values remain the same, all we need to do is divide the values by (-1)!
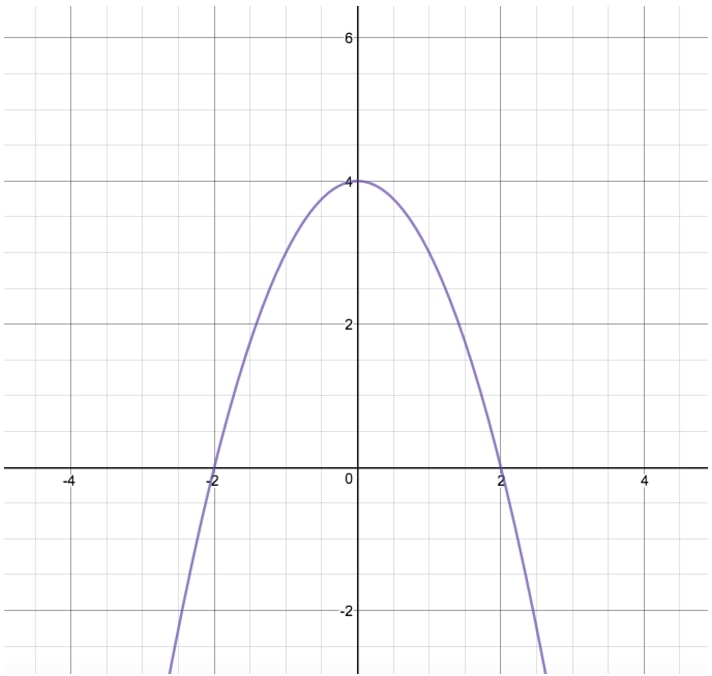
Step 4: Plot the new points
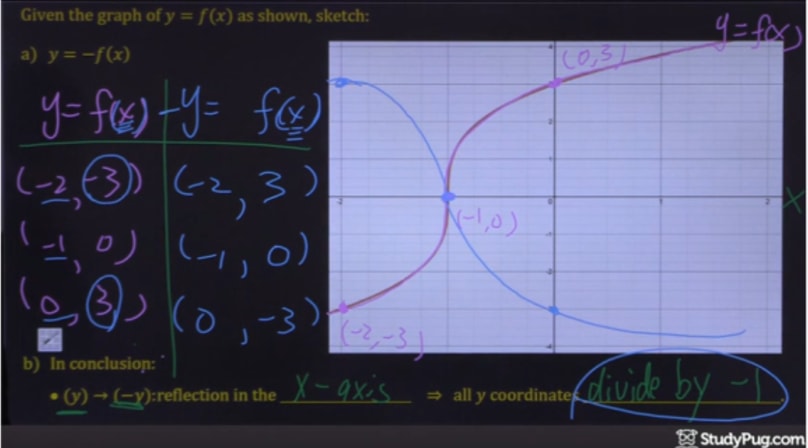
And that's it! Simple, right?
What is the Axis of Symmetry:
In some cases, you will be asked to perform horizontal reflections across an axis of symmetry that isn't the x-axis. But before we go into how to solve this, it's important to know what we mean by "axis of symmetry". The axis of symmetry is simply the horizontal line that we are performing the reflection across. It can be the x-axis, or any horizontal line with the equation = constant, like = 2, = -16, etc.
How to Find the Axis of Symmetry:
Finding the axis of symmetry, like plotting the reflections themselves, is also a simple process. In this case, all we have to do is pick the same point on both the function and its reflection, count the distance between them, divide that by 2, and count that distance away from one of the graphs. This is because, by it's definition, an axis of symmetry is exactly in the middle of the function and its reflection.
The best way to practice finding the axis of symmetry is to do an example problem.
Example:
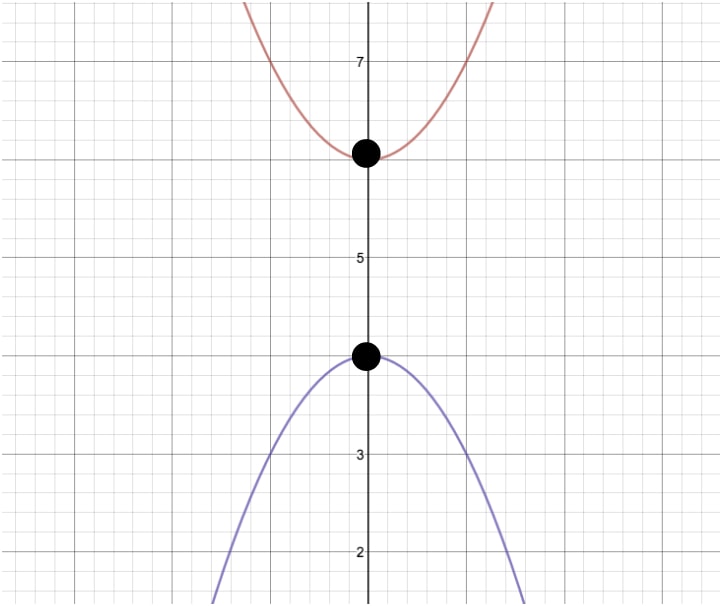
Find the axis of symmetry for the two functions shown in the images below.
Again, all we need to do to solve this problem is to pick the same point on both functions, count the distance between them, divide by 2, and then add that distance to one of our functions. Let's pick the origin point for these functions, as it is the easiest point to deal with.
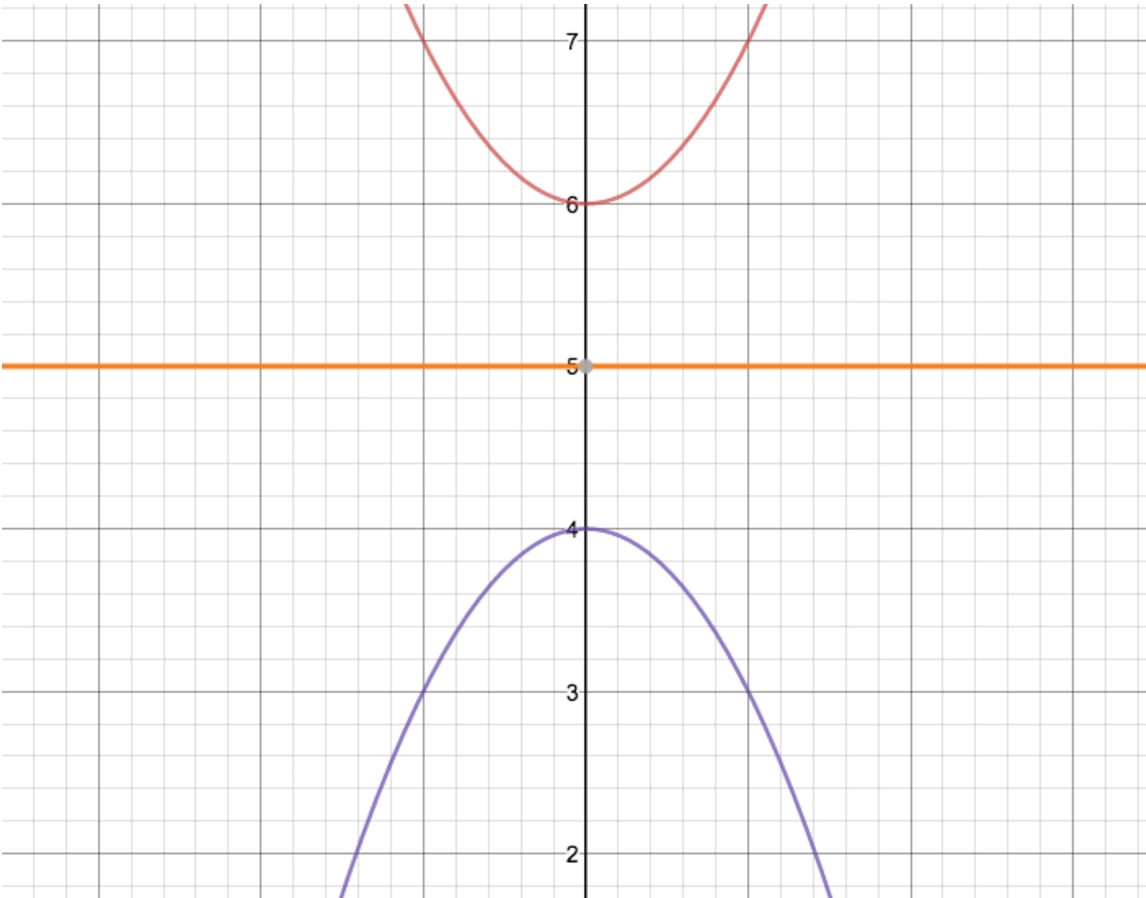
Now, by counting the distance between these two points, you should get the answer of 2 units. The last step is to divide this value by 2, giving us 1. Now we know that our axis of symmetry is exactly one unit below the top function's origin or above the bottom functions origin. Looking at the graph, this gives us = 5 as our axis of symmetry! Let's take a look at what this would look like if there were an actual line there:
And that's all there is to it! You may learn further on how to graph transformations of trigonometric functions and how to determine trigonometric functions from their graphs in other sections.